Tips and tricks
To go further with D.SIDE
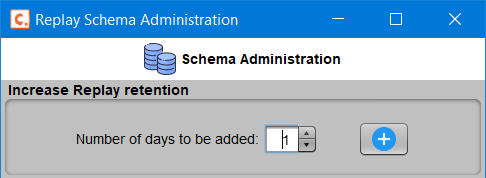
Replay schema administration
Replay schema administration Using the D.SIDE Console is very easy to manage the Replay collection schema to modify retention or free up space. All available operations (adding days, deleting a day, or clearing a day) can be performed with just a few clicks in the...
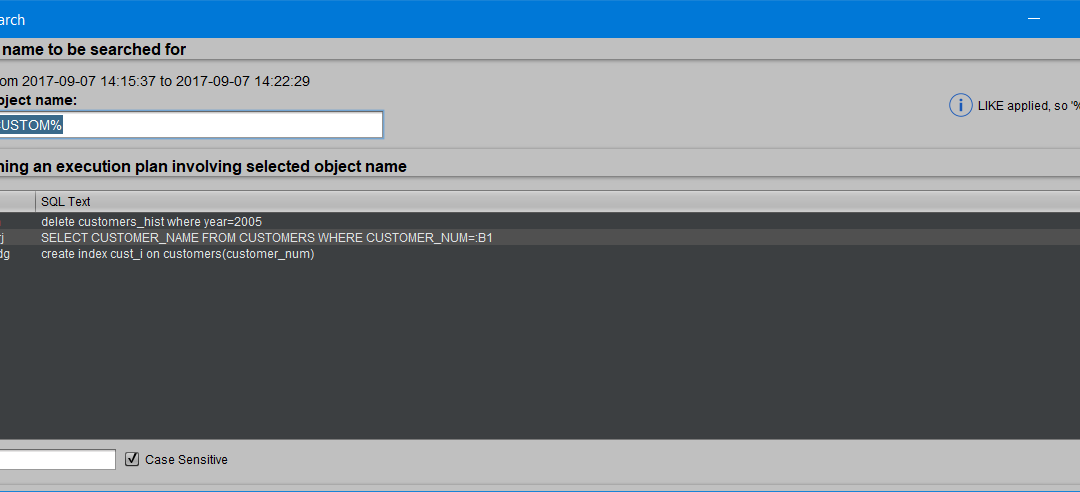
Object search
Has an Oracle object been used during a period? The Replay window summarizing Oracle activity provides, among other details, a list of SQL queries that consumed time (elapsed time) or resources (CPU, IOs) during the selected period. The 'Object search' button opens a...
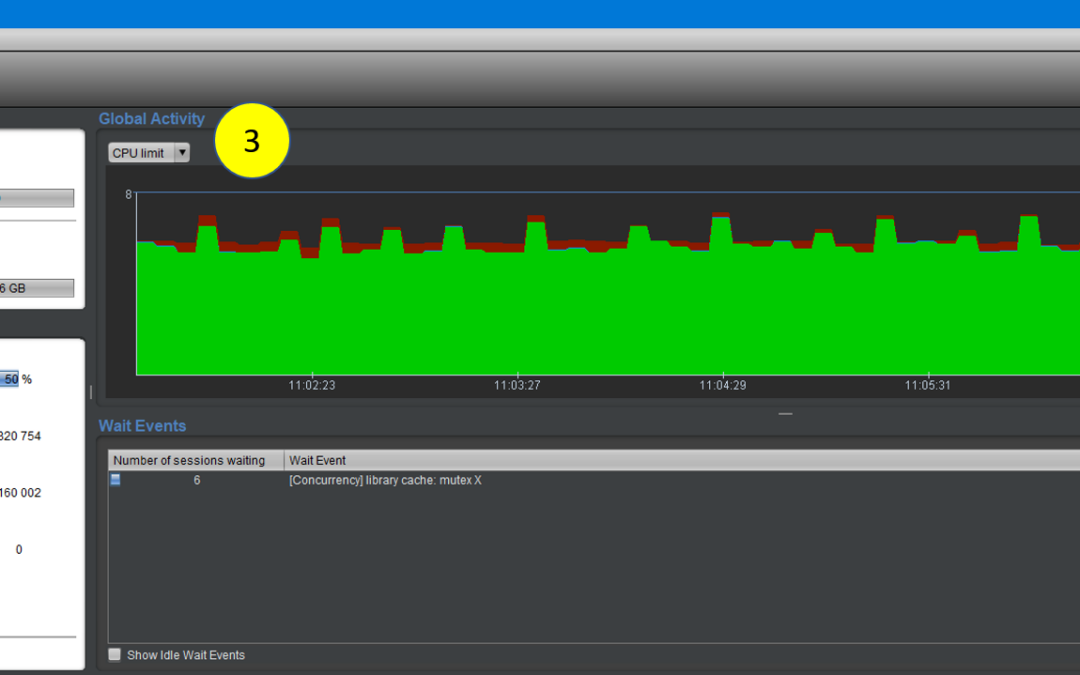
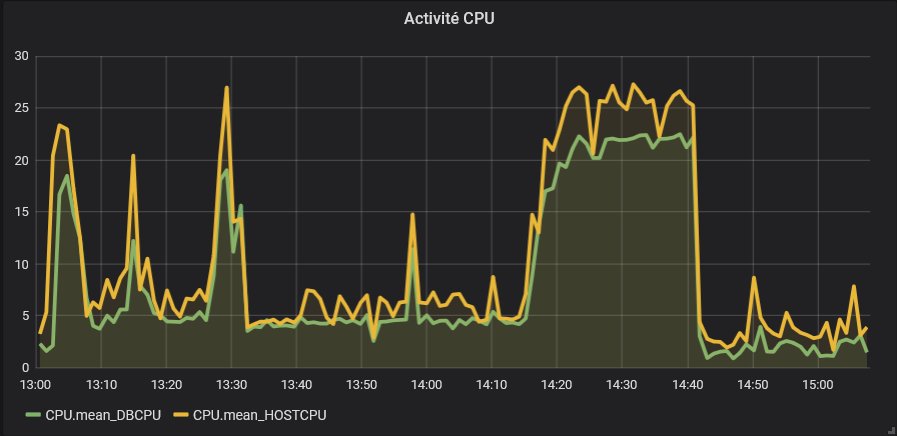
Oracle SE2: Reading CPU Limit with d.side
CPU Consumption by Oracle The main D.SIDE screen allows real-time monitoring of the overall CPU consumption of our Oracle instances. For this, we have several indicators distributed across 3 different areas of the screen. Example: 1 - he DSIDE instance is hosted on a...
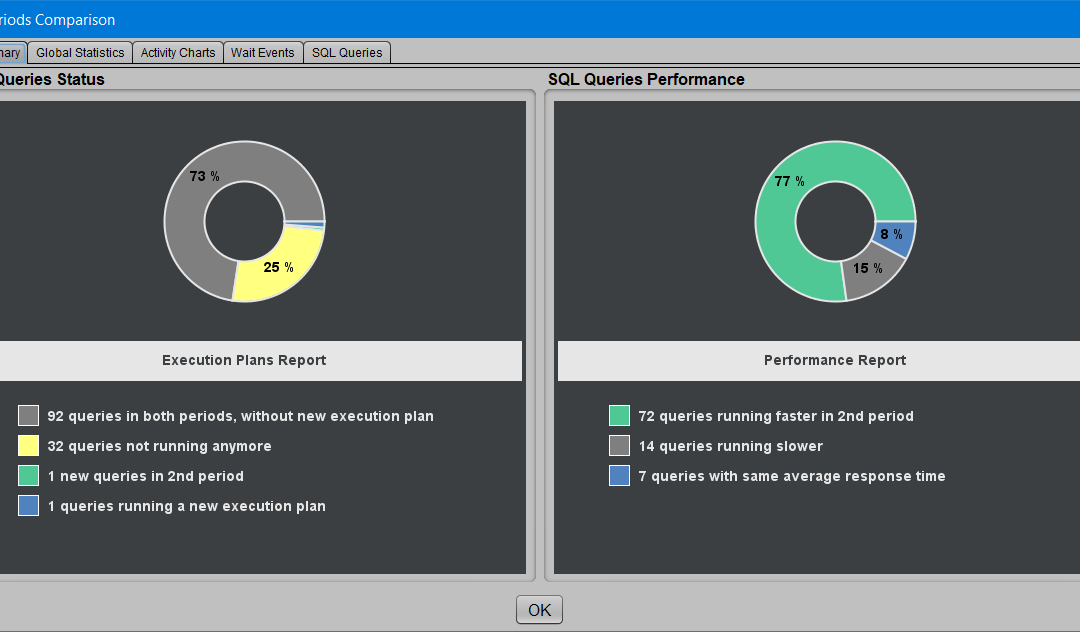
Period comparison
Why Compare Two Periods? There are various situations when comparing two periods may be necessary. Here are some use cases: Performance Monitoring: Tracking the evolution of load or behavior of an Oracle database. A process took longer than usual: why? A process ran...
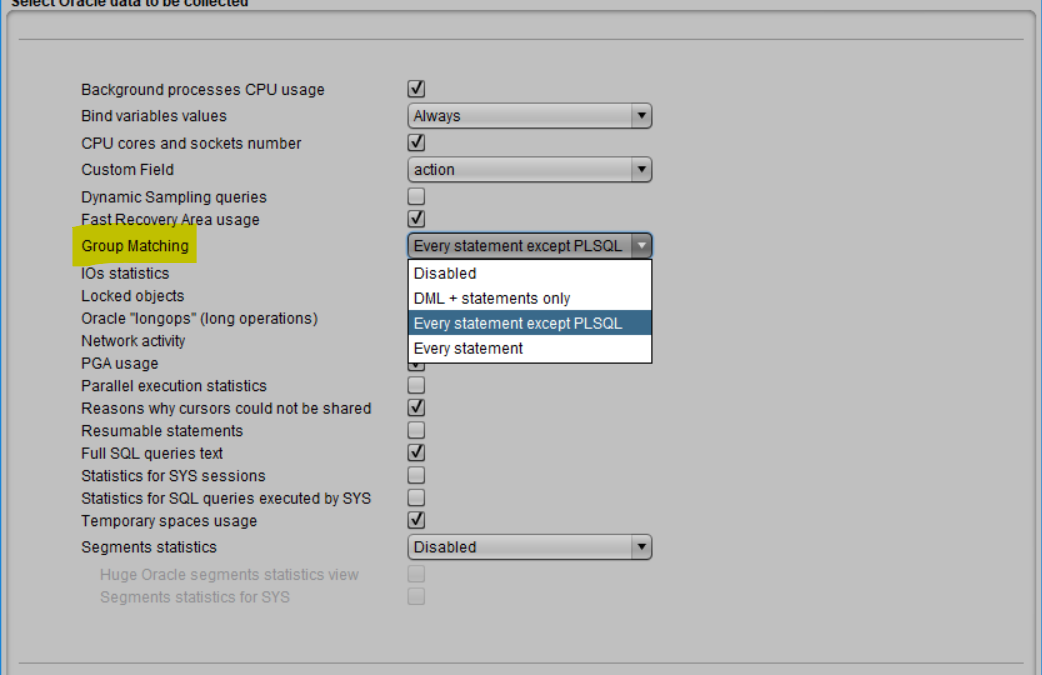
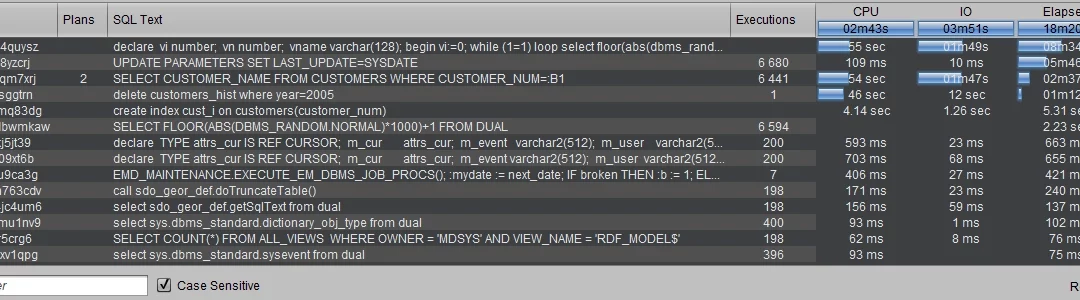
Group Matching
WITHOUT BIND VARIABLES, DIAGNOSTICS BECOME MORE COMPLICATED When many individually fast queries are executed, it becomes difficult to determine which SQL statements are the costliest among the Oracle activity. Each query may only take a few milliseconds of elapsed...
Oracle alerting
Introduction The D.SIDE alerting module for Oracle allows for the detection of: An increase in activity or consumption: CPU, physical reads, number of sessions, etc. A decrease in activity: fewer queries executed, fewer transactions, etc. A drift in response time for...
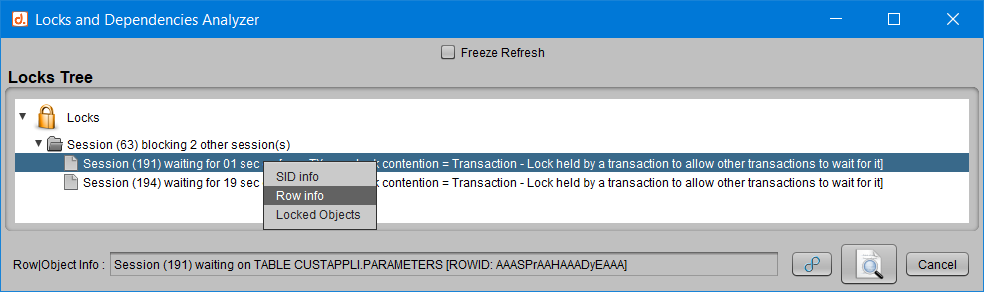
Interpret the content of the Locks and Dependencies Analyzer
OBJECTIVES OF D.SIDE ANALYZERS D.SIDE Analyzers, like the main D.SIDE screen, are designed to detect whether the monitored Oracle instance is experiencing performance issues. If so, they help pinpoint the source of the slowdown or blockage, guiding towards a...
API d.side Replay
Introduction The data collected by the Replay capture job via the DSIDE_REPLAY.GATHER procedure is typically used by D.SIDE Interactive Replay. It is also easy to transfer this data using the provided export/import tools. Now, you can even use this data without going...
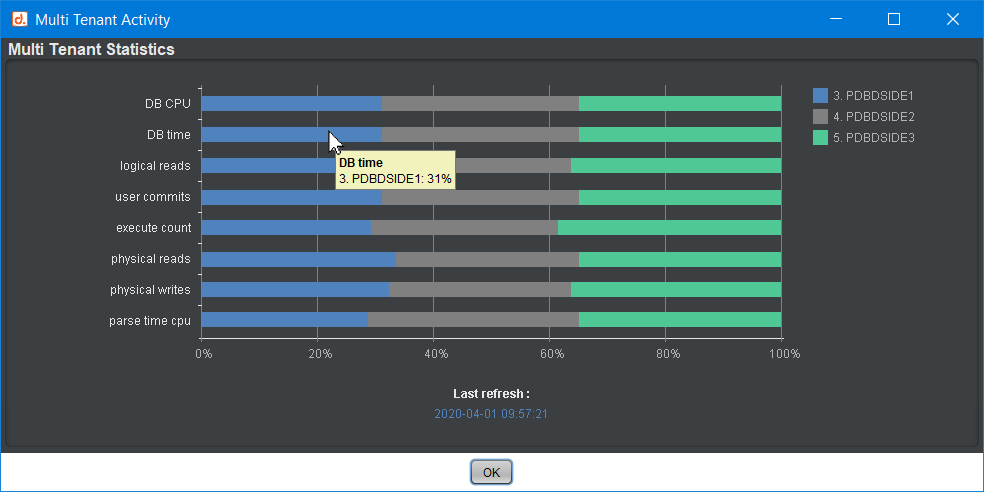
Multitenant Activity
The objective of the Multitenant Activity Feature Connection at the Container Level When a connection is established to a container with multiple pluggable databases (PDBs), the Multitenant Activity feature provides an instant overview of how the activity is...
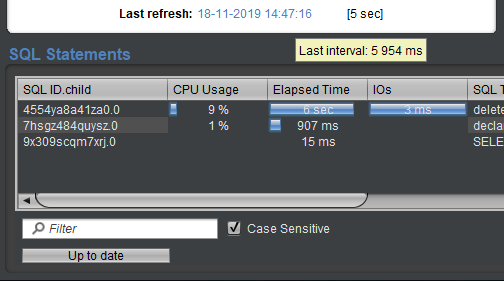
d.side Performance and Response Time
By default, D.SIDE displays the status of the monitored database every 5 seconds. This short interval between two snapshots corresponds to the time during which D.SIDE pauses before fetching more recent information from the Oracle database dictionary. The queries...
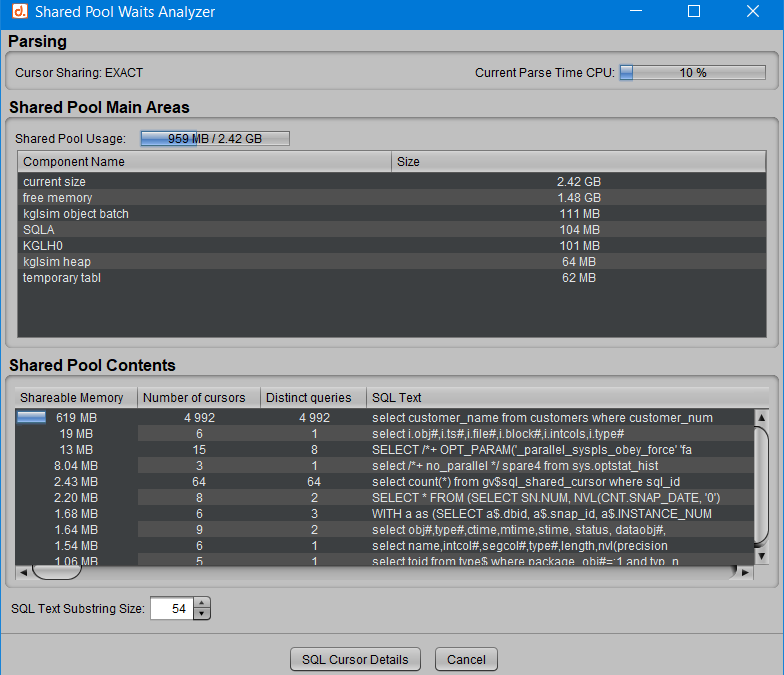
Interpret the content of the Shared Pool Analyzer
Objectives of D.SIDE Analyzers The D.SIDE Analyzers, like the main D.SIDE screen, are designed to detect if the monitored Oracle instance is being affected by a performance issue. If so, they help point towards a resolution by identifying the cause of the slowdown or...
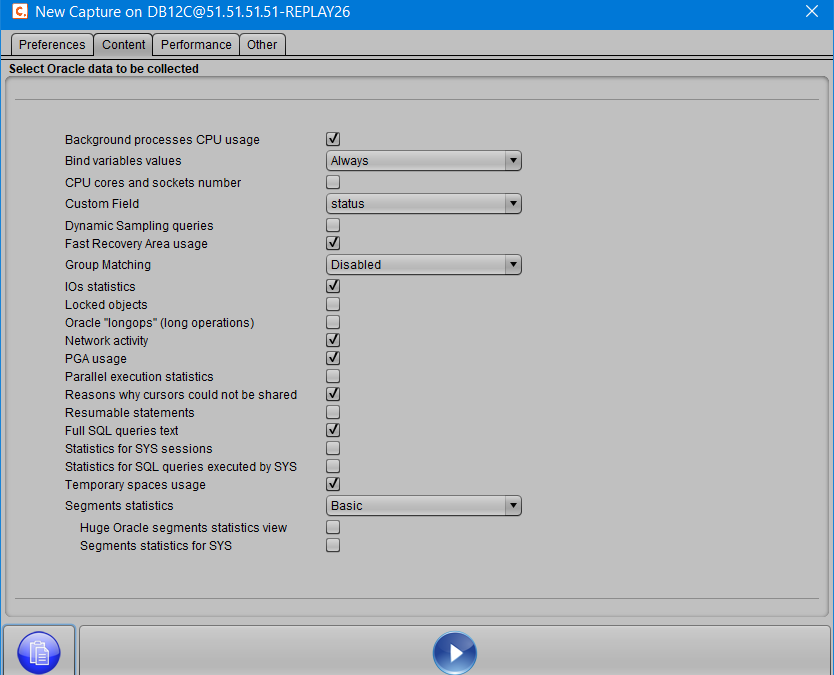
Copy Capture Options at Launch
When launching a new capture, it is very easy to apply the options that were previously used for a past collection. This can be very useful when you want to launch multiple captures on different databases but with the same options. It avoids the need to manually...
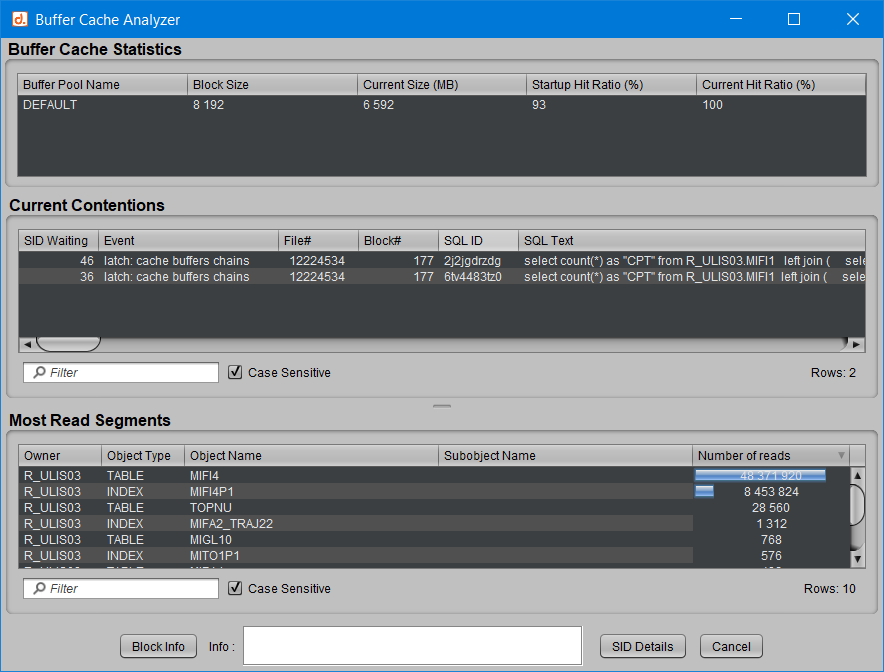
Interpret the Content of the Buffer Cache Analyzer
Objectives of D.SIDE Analyzers The Analyzers, like the main D.SIDE screen, are designed to detect if the monitored Oracle instance is experiencing performance issues. If so, they help pinpoint the cause of the slowdown or blockage. The goal is to identify any excess...
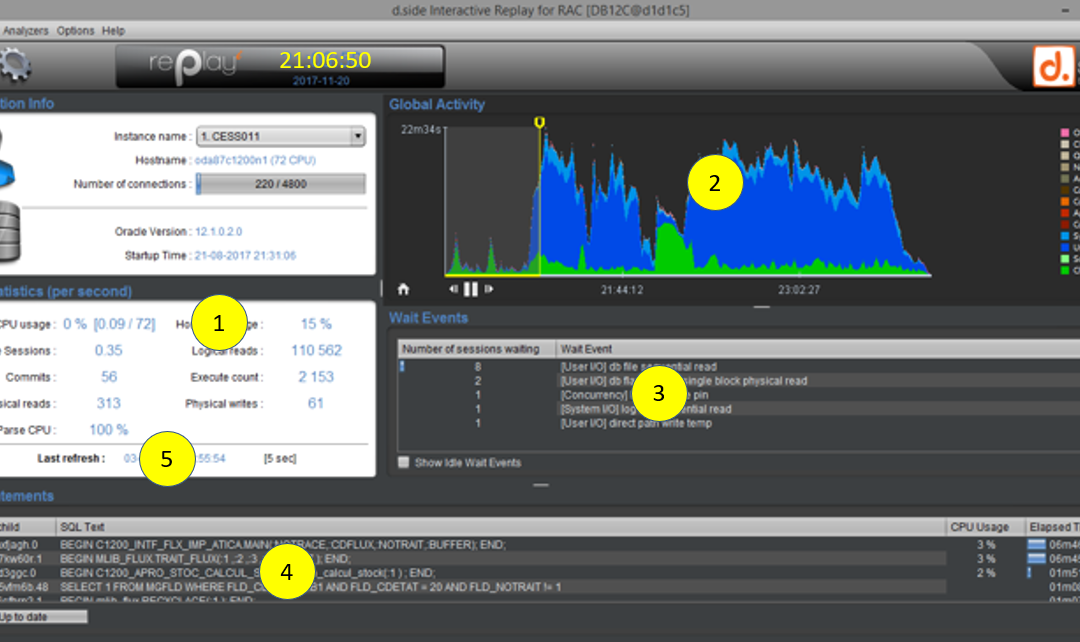
How to interpret main screen content
How to interpret main screen content To determine whether the monitored Oracle instance is behaving well or is experiencing issues, you can check the main screen for excessive items. Here is a list of indicators that, if considered excessive, may indicate a point...
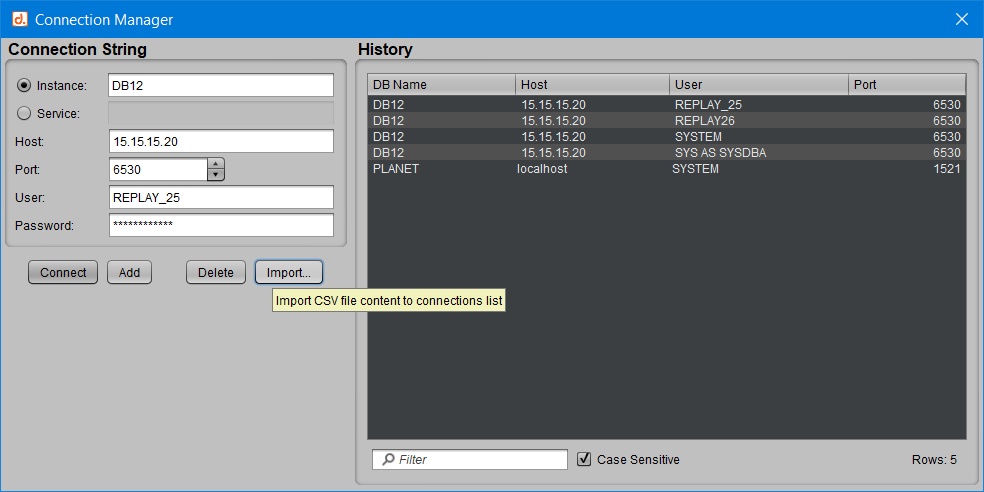
Import a CSV File into the Connection List
Objective Instead of manually entering each connection string when connecting to each instance or service, it is possible to retrieve a list of connections from a flat file. This can be very useful when managing numerous databases. You will then have access to all the...
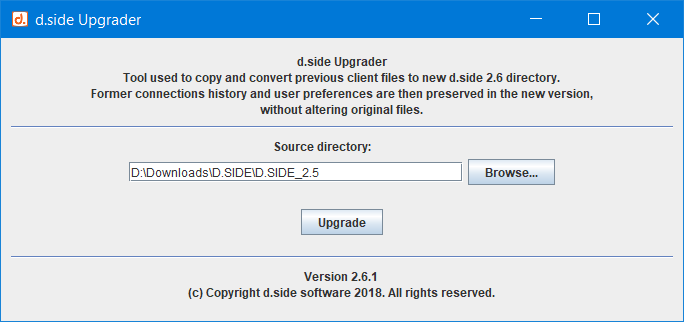
Upgrade of the Client to D.SIDE 2.6
Upgrading the Client to D.SIDE 2.6 When installing version 2.6 of D.SIDE, it is possible to recover elements from a previous client if an earlier version is being used: User preferences Real-time and Replay connection history Link to the "Reference Database" in the...
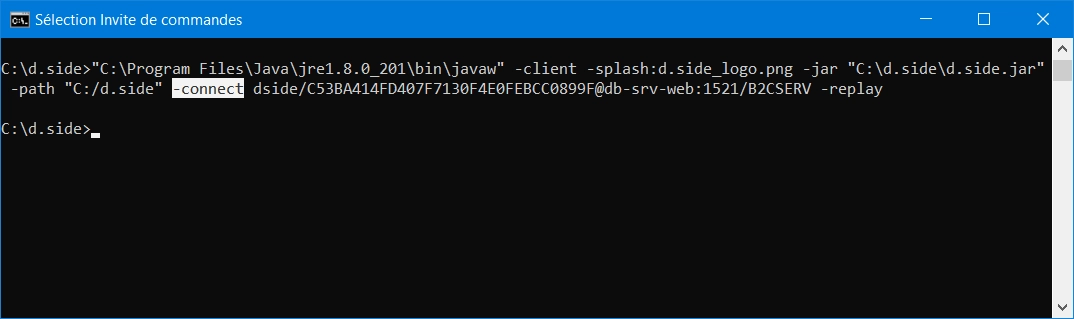
Automatic connection
An automatic connection mode, without interaction, is available. It allows you to provide a password when launching D.SIDE in real-time or Replay mode. This way, you bypass the "Connection Manager" window and are directly taken to the main screen of D.SIDE in...
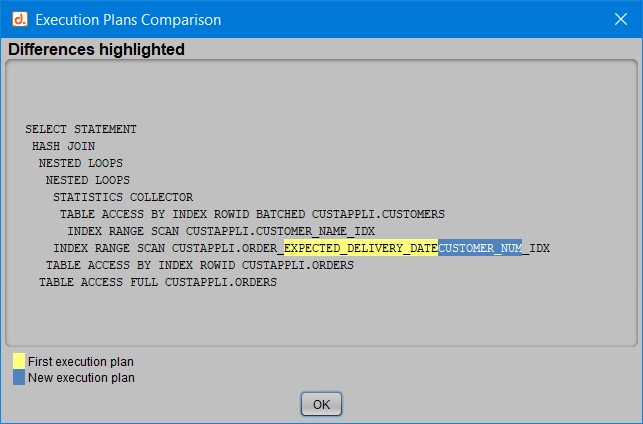
Compare Two Execution Plans
A query is currently running, and the SQL Info window allows you to monitor it: The performance of this query degrades after a certain period.Opening another SQL Info window allows you to monitor its new behavior: At first glance, there doesn’t seem to be much...
Filters and Special Characters
Our different products (D.SIDE Real-Time, D.SIDE Interactive Replay, D.SIDE Console) offer a filtering system to easily locate data in a list or screen, or to reduce the volume of displayed information. These filters are available in many windows, such as the main...