


► Diagnose
any situation: CPU consumption, a batch job that keeps running…
► Anticipate
with tools like SQL tuning assistant or periods comparison…
► Verify
that everything is operating correctly on the database
► Share
the production activity to view it in an environment accessible to everyone
D.SIDE allows you to track Oracle activity
Real-time AWR History Replay

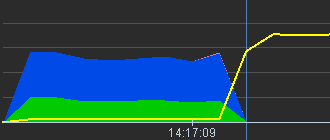
Live
Check in real time each insight of your database activity

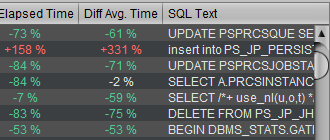
From an AWR history
explore from overall activity to the optimization of your SQL queries

Replay
Review your database activity and optimize your applications within a few clicks
Why
D.SIDE is UNIQUE ?
No wasted time to figure out what you’re looking for, D.SIDE highlights it instantly for you.
Thanks to its user-friendly interface, you have an innovative solution at your disposal that guides and assists you in observing your databases and applications, interpreting and understanding any situation, all the way to optimizing your SQL queries with its One-Click assistant.
Save time
Save money
Make the right decisions in record time :
• Observe :your databases and applications in real-time or replay
• Detect : any unusual situation
• Analyze : every changes in detail to understand its root cause
• Optimize : in one click, an SQL query or a process
• Confirm : At a glance that everything is perfectly performing
Save time
Save money
Make the right decisions in record time:
• Observe: your databases and applications in real time or Replay
• Detect: any unusual situation
• Analyze: every change in detail to understand its root cause
• Optimize: in one click, an SQL query or a process
• Confirm: at a glance that everything is performing perfectly
D.SIDE Helps
DBA Developers Everyone
Production
Stay in control of your databases at all times.
Instantly check that everything is running smoothly.
Quickly track down any performance issues.
With D.SIDE, you’re ready to react fast and stay ahead.
Test-QA
Audit the quality and performance of an application version.
Compare the performance between two versions.
Prepare and monitor a migration.
Analyze the change in your databases to anticipate future needs.
Development
Ensure that your SQL queries are optimized before moving them to production.
Easily monitor your applications using the developer-friendly interface.
Monitored databases
Smart Analyzers
In Business
Key features
New

AI: SQL Tuning by Anais
In one click, instantly get precise and relevant optimization suggestions for your SQL queries!

AI: SQL Report by Anais
Generate a complete and detailed HTML report in just one click and a few seconds, with suggestions to optimize processes over a specific period!
AWR Analyzer
Key Features Overview
+20 Smarts Analyzers
No need to search, one click and D.SIDE automatically opens the Analyzer corresponding to the situation: locks, IOs, redo logs, shared pool, buffer cache, undo, contentions, network, memory, latch…

Alerting
A drift in consumption, traffic, or response time is observed? React without waiting for the end of a delayed processing. See the article.

Reporting

Period Comparison
Anticipate (migration, upgrade, new version, etc.) or analyze by highlighting the differences between two executions. See the article.
Oracle RAC and ExaCC
Oracle multitenant
Check activity distribution between your pluggable databases (PDB). See the article.
Console
Indexes usage
Finally, reliably answer the frequent question “Which index can be deleted?”

Execution Plan Management
Effortlessly manage plan changes, often a major headache for DBAs, with a highly visual and efficient approach. See the article.

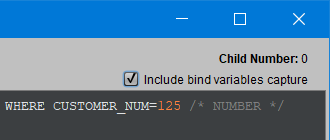
Cardinality Editor
Are you anticipating a volume change or has the Oracle optimizer misjudged a cardinality? Simulate a new cardinality without recalculating statistics!
API
Consolidate collected data for Replay and generate curves outside the D.SIDE interface [PL/SQL, REST]. See the article.

A complete toolbox
faqs
Can I attend a demo?
Contact us to schedule a one-hour demo.
Can I test d.side?
I am using Oracle Standard Edition, Does d.side support it?
Yes, d.side offers the same features in Standard Edition (SE, SE2) as in Enterprise Edition.
Does d.side rely on Oracle optional packs?
No Oracle option (Diagnostics Pack or Tuning Pack) is required to use d.side which only accesses free views in real-time or replay.
d.side for AWR relies on Diagnostics Pack.
How long does an installation take?
You access your databases within 3 minutes.
What are the installation requirements?
d.side is certified with java 11, regardless of the OS. You can access any Oracle database starting from version 10g.
What Oracle rights are required to use d.side?
d.side is read-only, CREATE SESSION and SELECT CATALOG ROLE privileges are sufficient.
Replay requires creating tables.
Do I need to deploy an agent to use d.side?
No agent is needed to use d.side live or on AWR. Replay requires running a PL/SQL package.
Is it possible to connect to a DataGuard database?
Yes, d.side allows you to connect to a Primary or StandBy DataGuard database.
Does d.side run on a virtual or shared machine?
Yes, d.side can be installed on a virtual machine or shared by multiple users.
Does d.side require training?
d.side is intuitive and easy to learn. No training is required.
We offer an optional Oracle Performance Training where you will use d.side on your real-world cases.
I am not a DBA, can d.side help me?
d.side offers a DBA profile and a developer profile in the user preferences.
Where can I find help to use d.side properly?
The documentation provided and the blog allows everyone to be autonomous.
Do I have access to support if I have questions?
Access to email support is available free of charge and without limit.
How does licensing work?
A license is purchased per user, with a decreasing rate from the second user. For more information, contact us.
What are the d.side options available?
d.side offers 3 options: Replay (navigate in time to work on a past activity), Anais (SQL tuning assistant), and RAC (observe the behavior of the interconnect).
Ready for
The Cloud?
D.SIDE supports you in adopting different types of Cloud architecture:
private, public, and hybrid.

Our latest
ARTICLES
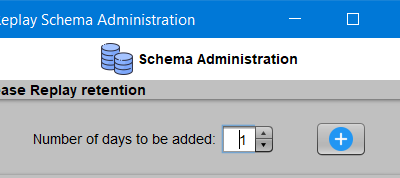
Replay schema administration
Replay schema administration Using the D.SIDE Console is very easy to manage the Replay collection schema to modify retention or free up space. All available operations (adding days, deleting a day, or clearing a day) can be performed with just a few clicks in the...
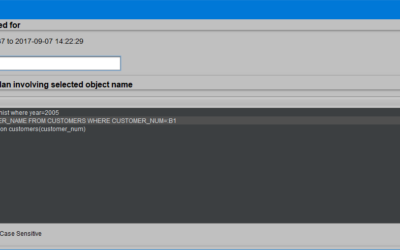
Object search
Has an Oracle object been used during a period? The Replay window summarizing Oracle activity provides, among other details, a list of SQL queries that consumed time (elapsed time) or resources (CPU, IOs) during the selected period. The 'Object search' button opens a...
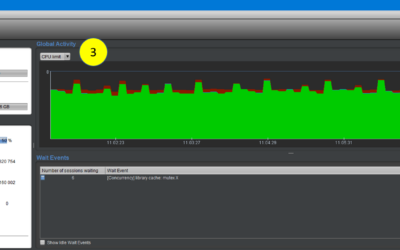
Oracle SE2: Reading CPU Limit with d.side
CPU Consumption by Oracle The main D.SIDE screen allows real-time monitoring of the overall CPU consumption of our Oracle instances. For this, we have several indicators distributed across 3 different areas of the screen. Example: 1 - he DSIDE instance is hosted on a...