
How to interpret main screen content
To determine whether the monitored Oracle instance is behaving well or is experiencing issues, you can check the main screen for excessive items.
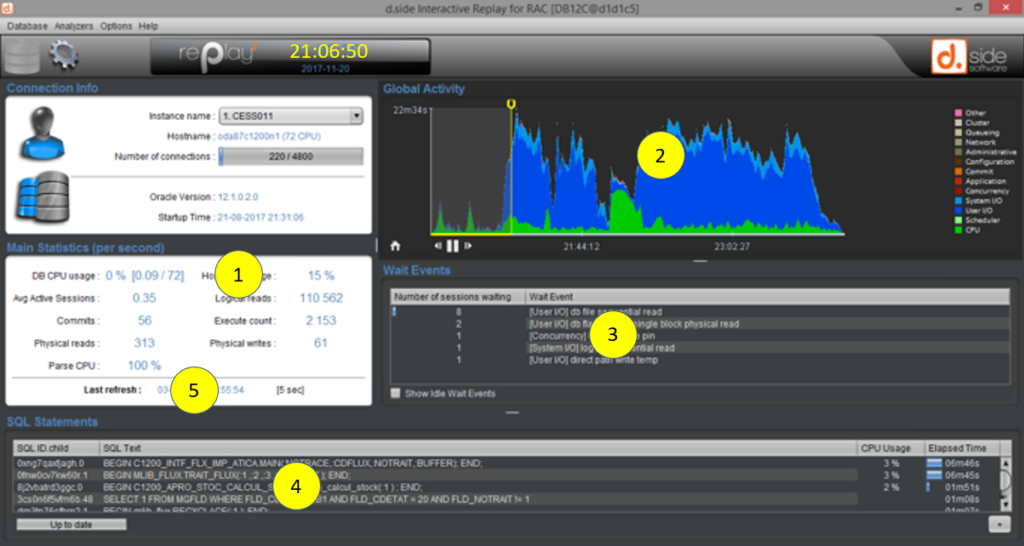
Here is a list of indicators that, if considered excessive, may indicate a point affecting the performance of the database.
1 – CPU consumption
Three statistics are of interest here:
DB CPU usage :
Oracle instance CPU consumption.
For example, Oracle is currently using just over 1 of the machine’s 4 CPU over the last elapsed interval, which represents 28% of the available CPU resources.

Host CPU usage :
CPU consumption at machine or database server level.
Example :

Parse CPU :
Clicking on “Parse CPU” statistic allows you to enter the “Shared Pool Analyzer” which highlights the elements leading to significant memory or CPU consumption in shared pool during the SQL query parsing phase. This phase corresponds to the analysis of the SQL query and the calculation of the execution plan by Oracle optimizer. If it consumes too much CPU, this is where the main screen notifies the user.
Example :

2 – « Global activity » chart
The “Global Activity” chart is used to measure CPU consumption and waits. This graph can be compared to the value of the “Average Active Sessions” statistic in the left “Main Statistics” panel because both mean the same thing:
Oracle consumption = « DB Time » = « Active Sessions” = CPU + waits
Global activity chart can be associated with three different scales.
Here are some examples, for which we consider that the interval between two snapshots is 5 seconds, which is the default value:
“Summed”
cumulative CPU and waits over the last 5 seconds. For example: 10 seconds of CPU and 15 seconds of waits means that 2 CPU are permanently in use and 3 sessions are permanently waiting for resources during the last 5 seconds.
“Average”
a “per second” calculation is performed. We then directly observe the 2 CPU and the 3 pending sessions. This is confirmed by hovering over the chart with the mouse:

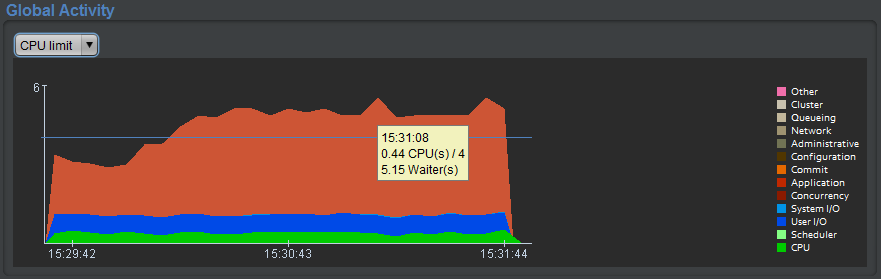
“CPU limit”
it is interpreted the same way, but the number of CPU is materialized by a horizontal line. Example with few CPU used (green surface) compared to the 4 CPU available, and 5 sessions permanently waiting on a lock (class “Application”):
3 – « Wait Events » panel
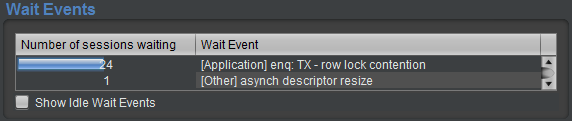
The number of established connections is visible in the “Connection Info” panel at the top left of the main screen:

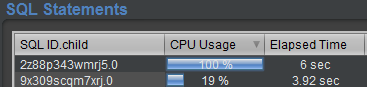
4 – SQL queries
Most of the time it is the execution of SQL queries that generates resource consumption: CPU as well as waits.
We will look for whether a query for example consumes a lot of CPU, which results in a high “CPU usage” value.
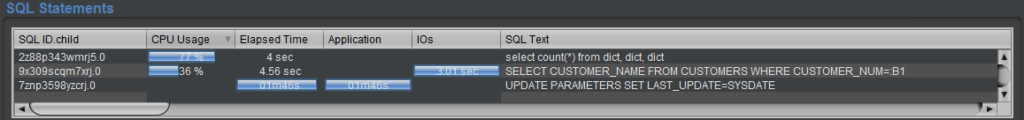
In the above snippet, the first query consumes a lot of CPU, while the second one also causes IOs (physical reads on disks), while the last UPDATE query spends all its time (Elapsed Time = Application = 1 minute 46) waiting for a lock (wait class “Application”) to be released.
Waits percentage
- The progress bar under the “IOs=3.01 sec” value of the second query represents 100%. This means that this SELECT totals the entirety (100%) of the IO times observed over the period, all queries combined.
- The progress bar under the “Application=1m46s” value of the third query also represents 100%, meaning in the same way that this SQL statement is responsible for the totality of the cumulative waits on locks during the last interval.
- The progress bar under the “Elapsed Time=01m46s” value is not quite at 100%. Indeed, the other queries represent 4 + 4.56 = almost 9 seconds. This is quite little, but it corresponds to about 7% of the cumulative “Elapsed Time”. The progress bar for the UPDATE order therefore displays almost 93% since this SQL order (which took 1 minute 46) alone corresponds to 93% of the three visible SQL orders (which total 1 minute 46 + 4 seconds + 4.56 seconds = approximately 1 minute 55).
Another example, 100% in “CPU Usage” means that the query spends all its time on the CPU, and therefore consumes, over the last 5 seconds, a CPU permanently.
If this query is executed twice at the same time (by two sessions simultaneously, for example), then we will have an “Elapsed” time of 10 seconds and still 100% of CPU, indicating an excess of CPU consumption, without specifying that it matches 2 CPU. 100% indicates that at least one CPU is consumed permanently, without detailing the precise number, because the objective on the main screen is to highlight excessive consumers of resources. Double-clicking on this query will then provide all the necessary details.
« Last refresh » data
One last element on the main screen can sometimes give you an idea of a global slowdown. This is the date of the last snapshot:

When the information, as here, is displayed in color, it means that it took more than a second to retrieve the elements constituting the last snapshot from Oracle, which is not usual.
By hovering over this date we get the time between the last two snapshots:
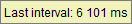
By default each interval between two snapshots is configured for 5 seconds. Here we have a little more than 6 seconds, which means that the last snapshot took more than a second to complete. Most of the time this can come from the network or the amount of information to be processed in shared pool when this Oracle memory area is oversized, for example, or poorly used (non-use of bind variables).
This “Last refresh” in color does not therefore directly highlight the cause but is a symptom of a general slowness in the queries sent to Oracle.
Conclusion
If no CPU, resource (IOs, etc.) or wait consumption statistics are significant (we are looking for an “excess”), then it is very likely that the monitored Oracle instance is not experiencing a performance problem.
If, on the other hand, the Oracle instance suffers from slowness or contentions, then we should observe high values for CPU, resources, time consumed or waits on the main screen. These symptoms should easily and quickly point us to the root of the issue: an SQL query, a blocking session, contention on a particular component, etc. More details that will allow us to deepen this diagnosis can be retrieved, for example, by clicking or double-clicking on the statistics or elements concerned.
To establish an initial diagnosis to determine whether the Oracle instance is behaving well or whether it is encountering difficulties, following the path suggested in this article therefore seems to be a good approach.