Anais, Your “One-Click Assistant”
for SQL Tuning
More than 80% of performance issues in an Oracle database are due to SQL queries.
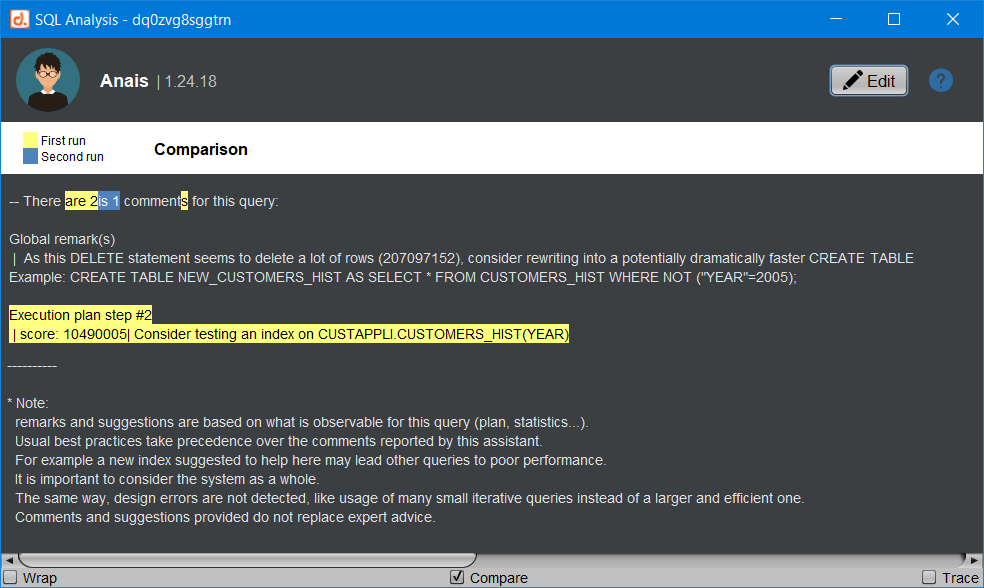
Anais, the “one-click” assistant for SQL optimization, addresses this issue with two main goals:
• Accurately identify the elements that can slow down a query.
• Provide solutions where possible.
Some examples of suggestions that Anais can make include:
• Add or change an index
• Rewrite the query
• Gather a statistic
• Change the join type
• Adjust an Oracle parameter
• Fix an anomaly
Anais takes just a few milliseconds to analyze the query and generate its recommendations. And with just one click, the user can get assistance!
Cardinality Editor
• Are you anticipating a volume change?
• Did Oracle optimizer misestimate cardinality?
• Or does a statistic seem incorrect?
• Simulate potential changes in Anais’ recommendations without gathering new statistics!
Anais Can Handle
Very Different Situations
Complexity :
Execution plans with hundreds of lines
Volume :
Tables containing billions of rows
Load :
Optimization of queries executed tens of thousands times per second

A poor execution plan, a missing index, outdated statistics, or an unoptimized query can be the cause of a significantly slowed application on a database.


Our latest
ARTICLES
Replay schema administration
Replay schema administration Using the D.SIDE Console is very easy to manage the Replay collection schema to modify retention or free up space. All available operations (adding days, deleting a day, or clearing a day) can be performed with just a few clicks in the...
Object search
Has an Oracle object been used during a period? The Replay window summarizing Oracle activity provides, among other details, a list of SQL queries that consumed time (elapsed time) or resources (CPU, IOs) during the selected period. The 'Object search' button opens a...
Oracle SE2: Reading CPU Limit with d.side
CPU Consumption by Oracle The main D.SIDE screen allows real-time monitoring of the overall CPU consumption of our Oracle instances. For this, we have several indicators distributed across 3 different areas of the screen. Example: 1 - he DSIDE instance is hosted on a...
