D.SIDE transforms the way to approach,
interpret, and understand
an AWR report
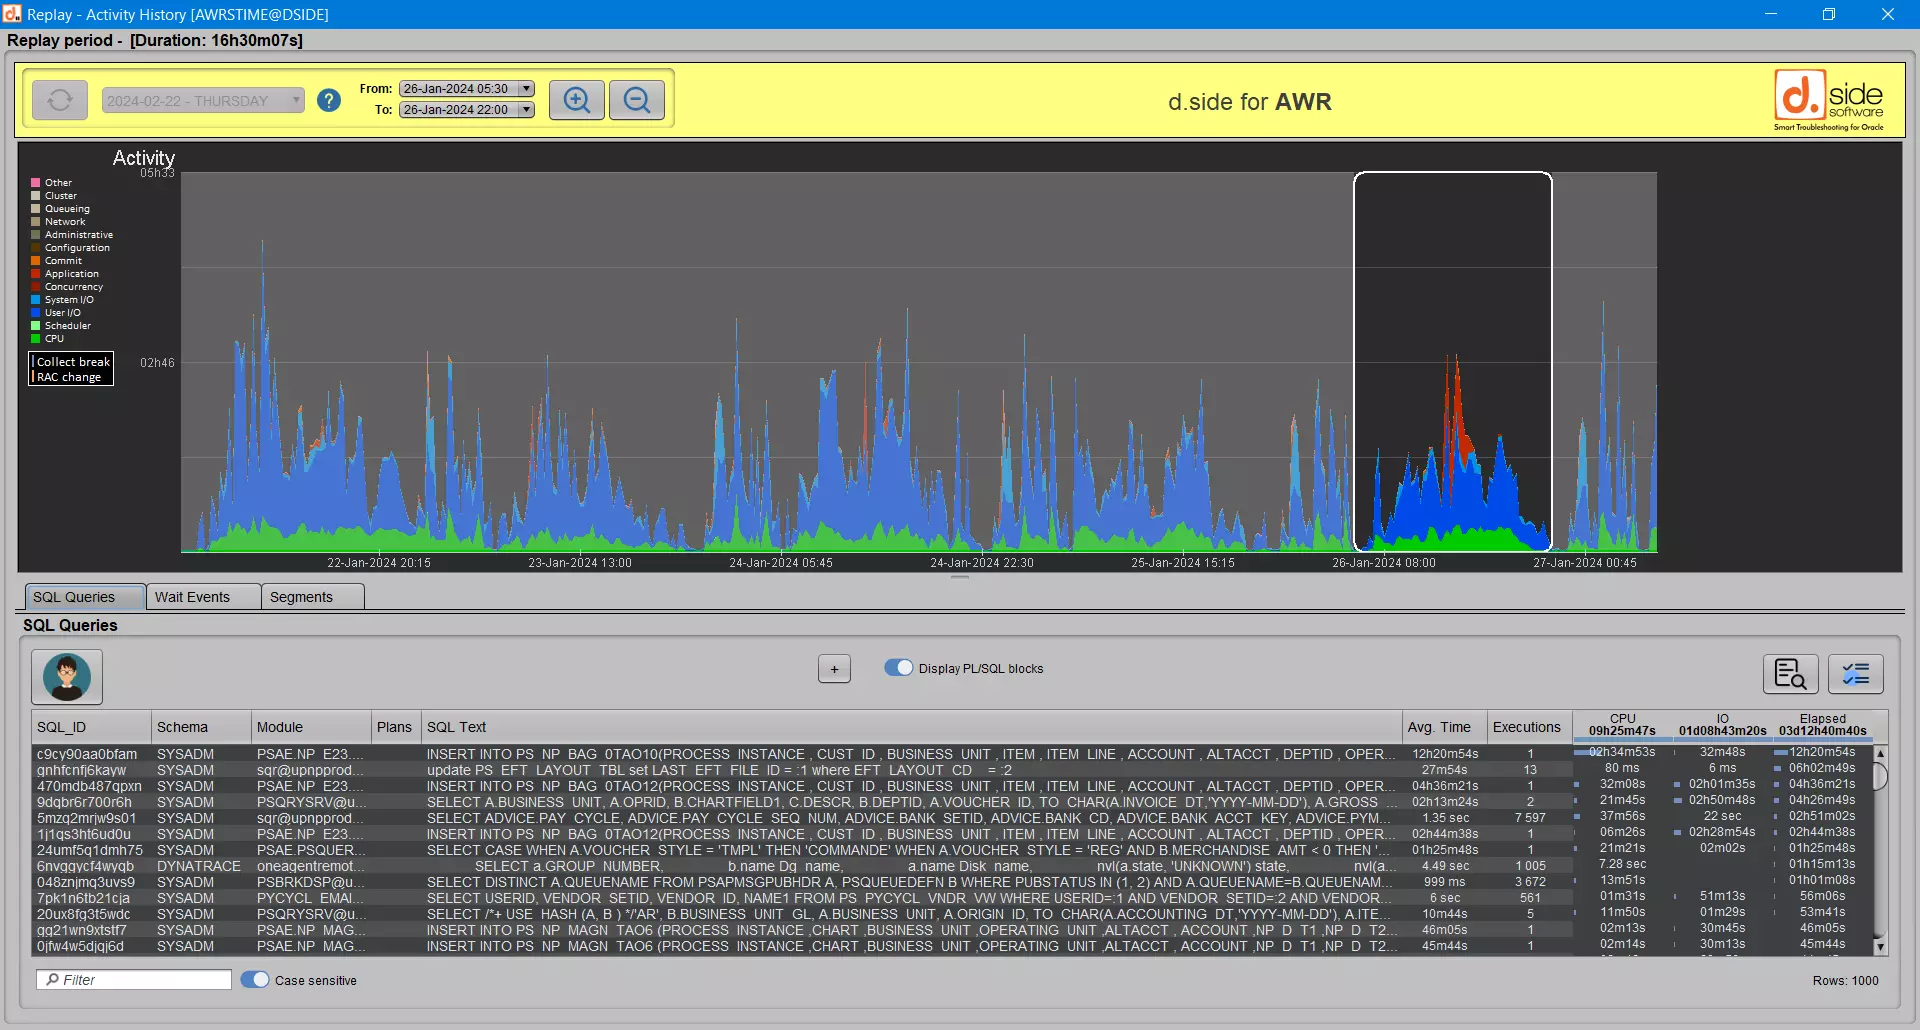
Through its graphical interface, it allows you to quickly and easily find the information you need by navigating, instead of having to scroll through and search thousands of lines.
| Rapport AWR | d.side AWR analyzer | |
| Graphics | ✘ | ✔ |
| Concise interface | ✘ | ✔ |
| Period selection to analyze | ✔ | ✔ |
| Dynamic navigation | ✘ | ✔ |
| Easy understanding | ✘ | ✔ |
| Simplified interpretation | ✘ | ✔ |
| Time-saving | ✘ | ✔ |
| SQL query sorting | ✔ | ✔ |
| SQL query filtering | ✘ | ✔ |
| Easier team sharing | ≈ | ✔ |
| Data for SQL optimization | ✘ | ✔ |
| SQL tuning assistant | ✘ | ✔ |
| SQL optimization report | ✘ | ✔ |
|
Details of provided data | ★★☆☆☆ | ★★★★★ |
With D.SIDE AWR Analyzer
Within a few clicks
Overview of all Oracle activity
at a glance
Navigate easily
and delve into the details
Analyze
the most resource-consuming queries
With all the necessary elements for their optimization: execution plans, tables, indexes, statistics, bind variables…
In an instant
access all relevant information
The period to focus on, a list of resource-consuming queries, their execution plans, the objects involved (tables, indexes, statistics, etc.),
bind variable values …
D.SIDE can even provide insights and recommendations to optimize your SQL queries, making them more efficient, using the SQL tuning assistant “Anais” and its “Anais Report” feature.
| Rapport AWR | d.side AWR analyzer |
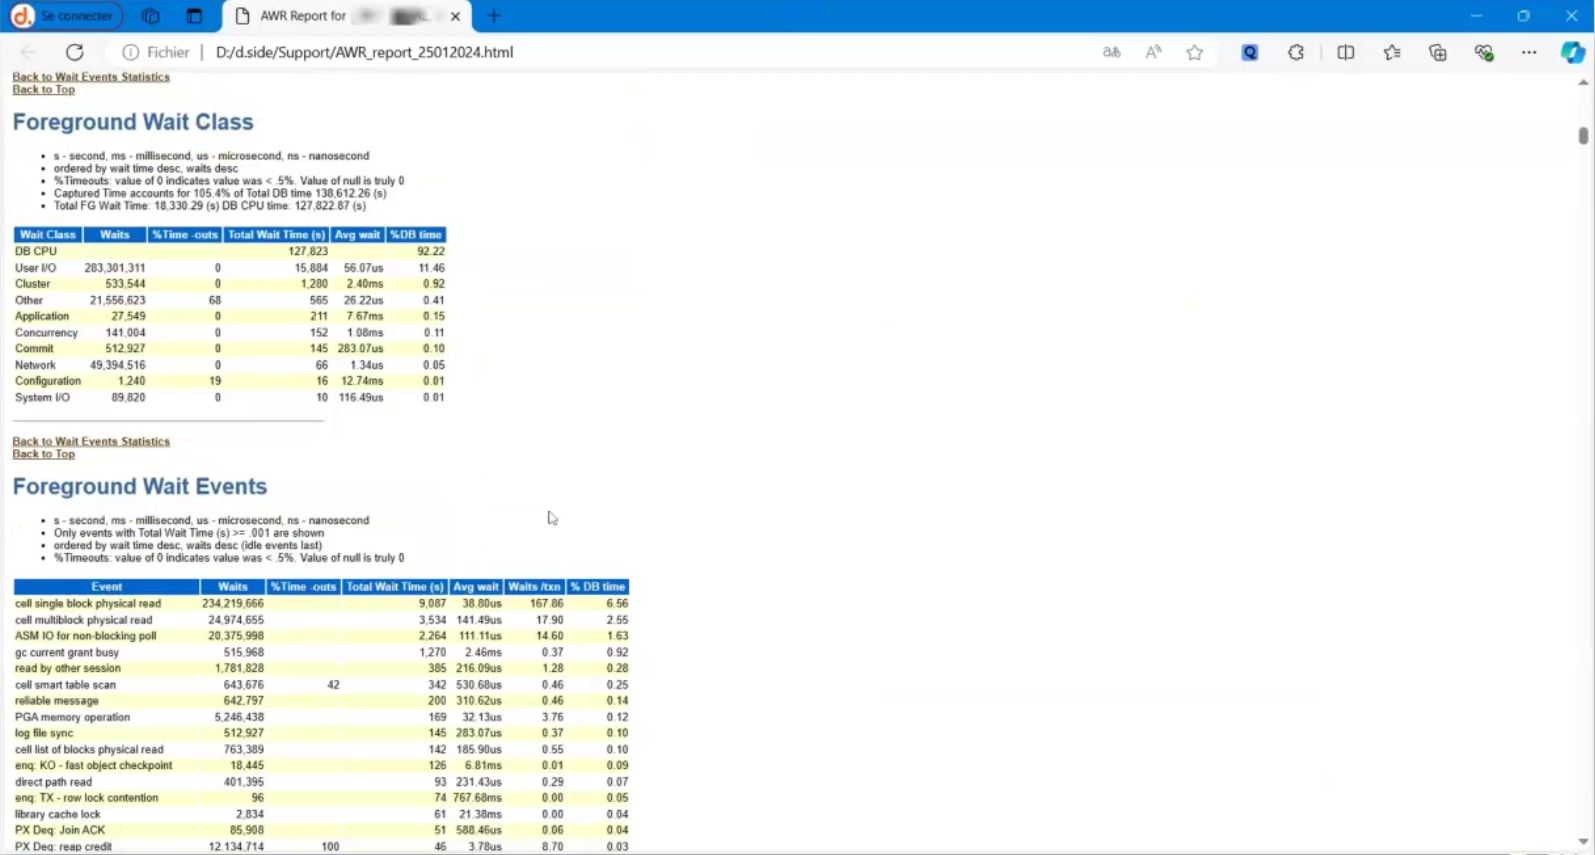
| • Flat file, static, representing a fixed period, with raw text spanning several thousand lines | ✔ Graphical representation for immediate reading |
| • Detailed analysis is required, with a risk of misinterpretation | ✔ Easy understanding of any situation |
| • Significant time spent searching and cross-referencing data to understand it | ✔ Automated and dynamic analysis of consumption spikes, zooming in on periods, sorting, and filtering queries... |
| • Missing information for SQL query tuning: tables, indexes, statistics, etc... | ✔ Availability of all essential information for SQL query optimization |
| ✔ AI-assisted with the 'Anais' SQL tuning option: get optimization suggestions for your SQL queries in seconds |
Over 80% of performance issues encountered in a database are attributed to the execution of SQL queries. However, an AWR report only provides the raw text of a few resource-consuming queries along with their execution statistics: execution count, CPU usage, I/O time, etc…
Essential elements for SQL optimization are missing in an AWR report: a list of tables, indexes, object statistics, and more.
With D.SIDE, you have access to all the necessary information for SQL query optimization through a streamlined interface. Additionally, the data generated by D.SIDE over an AWR period is easy to share across teams.
Our latest
ARTICLES
Replay schema administration
Replay schema administration Using the D.SIDE Console is very easy to manage the Replay collection schema to modify retention or free up space. All available operations (adding days, deleting a day, or clearing a day) can be performed with just a few clicks in the...
Object search
Has an Oracle object been used during a period? The Replay window summarizing Oracle activity provides, among other details, a list of SQL queries that consumed time (elapsed time) or resources (CPU, IOs) during the selected period. The 'Object search' button opens a...
Oracle SE2: Reading CPU Limit with d.side
CPU Consumption by Oracle The main D.SIDE screen allows real-time monitoring of the overall CPU consumption of our Oracle instances. For this, we have several indicators distributed across 3 different areas of the screen. Example: 1 - he DSIDE instance is hosted on a...

