The objective of the Multitenant Activity Feature
Connection at the Container Level
When a connection is established to a container with multiple pluggable databases (PDBs), the Multitenant Activity feature provides an instant overview of how the activity is distributed across the different PDBs. Is one PDB more heavily loaded than the others? Are resources being used evenly between each PDB? Are transactions evenly distributed, or is one PDB receiving fewer queries to process?
Each row corresponds to a statistic of the activity: CPU, logical reads, I/O, number of transactions, executions, etc.
Each represents 100% of the total activity for the entire container.
For example, in a container with two PDBs:
If both PDBs are executing approximately the same number of queries, the “execute count” statistic will show two roughly equivalent values of around 50% each.

If, on the other hand, one PDB processes, for example, 3 times more transactions than the other, the Multitenant Activity will display for the “user commits” statistic a bar representing 75% of the transactions, while the other bar will total the remaining 25%:

Connection at the PDB Level
When the connection is made to a PDB or a container with only a single PDB, the Multitenant Activity will then show statistics for that single PDB only.
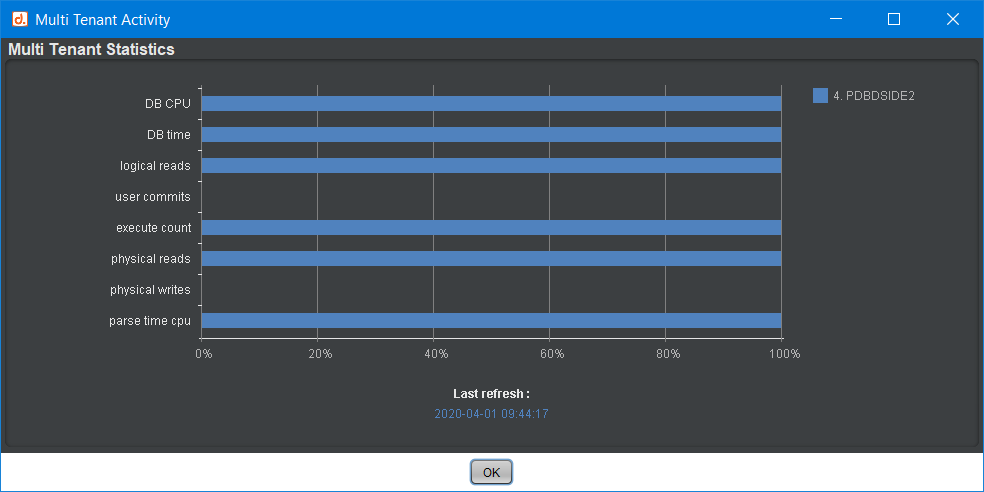
Here, we see that PDB number 4, “PDBDSIDE2,” is not performing any transactions and is not generating any physical writes.
But in this configuration, the Multitenant Activity is much less useful, showing that 100% of what happens in the database is attributable to this single PDB.
The goal of the Multitenant Activity feature is to provide a quick view of the balance between the PDBs, so it is most useful when connected at the container level.
Details
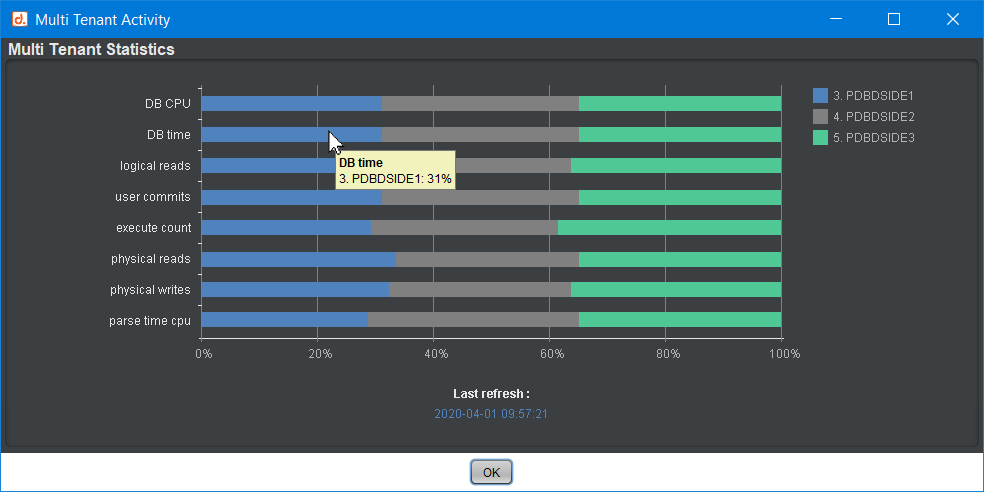
When hovering over the graph with the mouse, the Multitenant Activity shows which statistic and which PDB it refers to, specifying the value of that statistic as a percentage of the total.
In the following example, by hovering over the blue sector of the second row, we can see that PDB number 3, “PDBDSIDE1,” accounts for 31% of all the “DB Time” consumed within the container.
Use Case Examples
Use Case 1
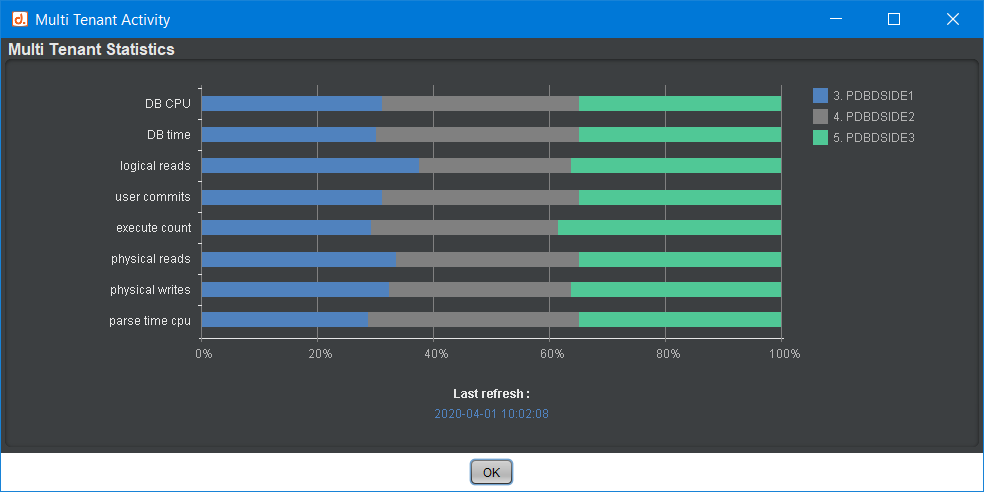
In this first case, the Multitenant Activity confirms that the 3 PDBs of the container are evenly distributing resource consumption and load (CPU, I/O, number of transactions, etc.).
Use Case 2
In this situation, however, the Multitenant Activity highlights that PDB number 3, “PDBDSIDE1,” is handling more transactions (number of commits) than the other two PDBs, while consuming significantly fewer resources (CPU, I/O).
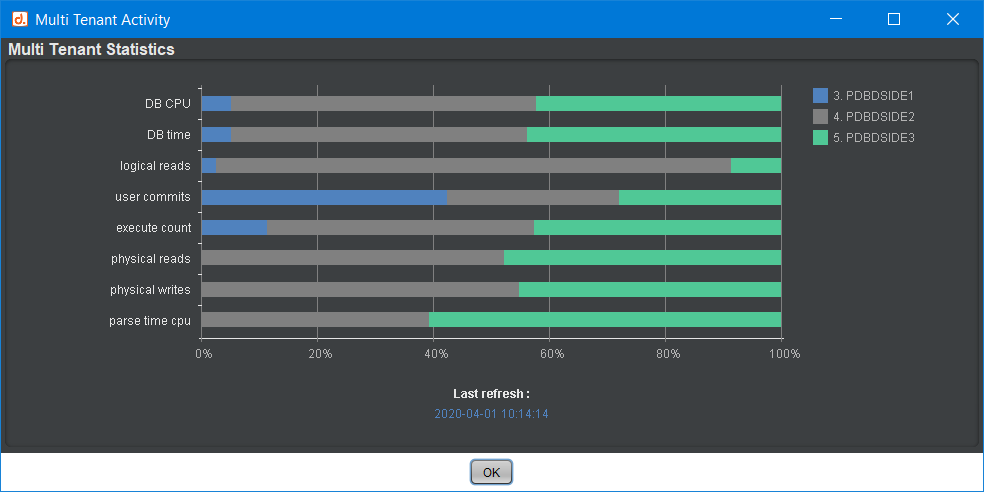
The other two PDBs are sharing the consumed resources or load statistics fairly evenly. We just observe slightly more “logical reads” for PDB number 4, “PDBDSIDE2.”
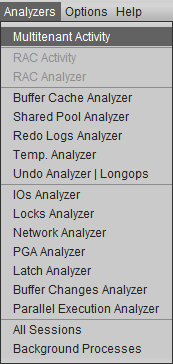
How to Open the Multitenant Activity
The “Multitenant Activity” window is directly accessible from the D.SIDE Analyzers menu:
Oracle User and Required Privileges
To have a view of all the PDBs from a connection to the container, it is necessary to use a user-like SYSTEM, for example, or create a new “common user.”
Example of creating a common user:
CREATE USER c##myuser IDENTIFIED BY mypassword CONTAINER=ALL;
GRANT CREATE SESSION, SELECT_CATALOG_ROLE TO c##myuser CONTAINER=ALL;
ALTER USER c##myuser SET CONTAINER_DATA=all CONTAINER=CURRENT;
The CONTAINER=ALL and CONTAINER_DATA=ALL clauses allow the common user to be created in all PDBs and provide access to the statistics for each. This is essential to be able to use the Multitenant Activity feature. Without these privileges, you may encounter missing data, invisible PDBs, or even an empty window, as well as Oracle errors such as:
ORA-1435: user does not exist
Note:his is an Oracle instance parameter that requires a common user’s name to be prefixed by default with C##:
common_user_prefix=C##
Conclusion :
When used at the ROOT container level of the CDB, Multitenant Activity provides a comprehensive, global view of resource consumption and load distribution across the various PDBs it contains.
This makes it easy to quickly detect whether the balance between these PDBs is maintained or if some are consuming more or fewer resources than others.
Additionally, you can always connect to each PDB independently with D.SIDE to get detailed information for each one (wait events, SQL queries, etc.), as usual.