
Our different products (D.SIDE Real-Time, D.SIDE Interactive Replay, D.SIDE Console) offer a filtering system to easily locate data in a list or screen, or to reduce the volume of displayed information. These filters are available in many windows, such as the main screen of D.SIDE, the summary screen of D.SIDE Interactive Replay, various Analyzer panels, the main screen of D.SIDE Console, and more. This filtering mechanism is presented as a text box labeled “Filter” and a checkbox for “Case Sensitive”:

The “Case Sensitive” Option
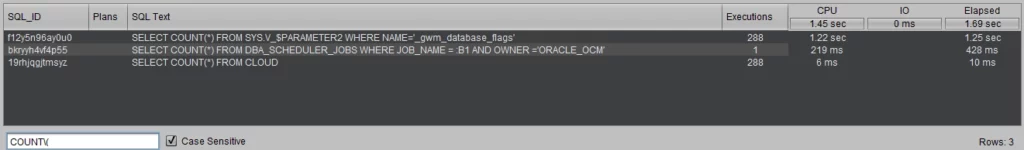
Enabling this option makes the search tool case-sensitive, meaning it will differentiate between uppercase and lowercase letters in its searches.
Thus, the following input:
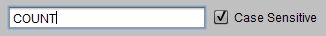
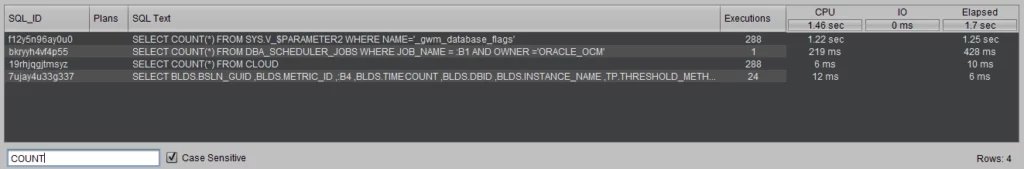
Will retrieve all items in the list containing exactly the word “COUNT” in uppercase.
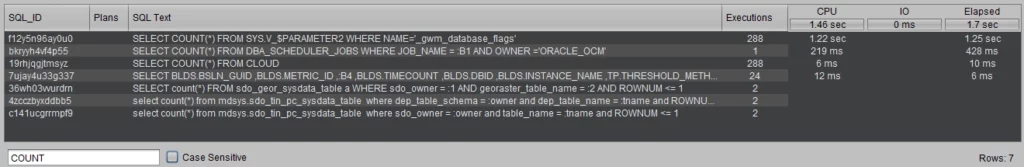
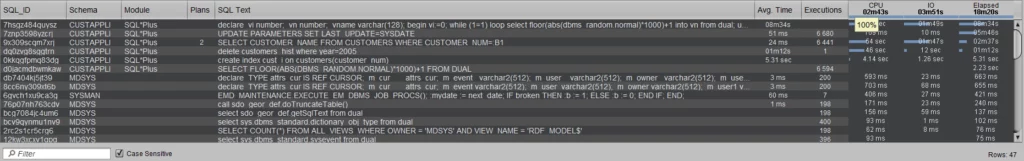
If the option is not selected
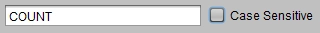
The same input will produce a less selective result, returning more rows, corresponding to all strings that contain an occurrence of the word “count,” regardless of the uppercase or lowercase letters that make it up:
The “Filter” Area
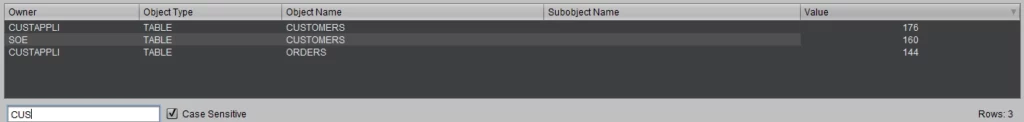
The text box in the filter area allows you to specify the text you are searching for in the associated list.
You can use this area to specify all or part of a string, whether it corresponds to an SQL ID or the text of a query when you’re on a query list, a session number or username when using the All-Sessions Analyzer, a module name in the Redo Logs Analyzer, or an object type or name in the Buffer Cache Analyzer.
Example :
Special Characters
The searches are based on a mechanism similar to regular expressions.
As a result, if the search text contains what are called metacharacters, such as parentheses or an asterisk, it is necessary to precede these special characters with a backslash (called an escape character): \
For example, if in the previous query list, you are only searching for those that match a “COUNT(*)”, then the text containing “TIMECOUNT” will no longer appear if you add “(*)” to “COUNT”.
To do this, you must use the escape character before each special character. The search string becomes: COUNT\*\*\*.
Example :
SQL Query Consumption
If no filter is applied to the list of SQL queries displayed for a Replay period, then all queries are visible, and 100% of the activity is represented in this list.
Hovering the mouse over the title of any of the “CPU”, “IO”, or “Elapsed” columns confirms that the column contains 100% of the SQL activity.
If a filter is then entered, reducing the observed activity, the progress bars in the column titles, as well as the value displayed on hover, show the total activity remaining visible once the filter is applied.
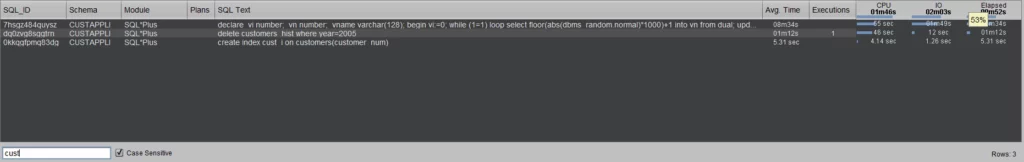
In this case, it is evident that the filter applied shows only the 3 queries containing the text “CUST”, and these 3 queries account for 53% of the total SQL consumption in Oracle.
Summary: all the queries counted over the period (excluding the filter) represent 100% of the activity, while the 3 queries visible after applying the filter account for 53% of that total activity. Therefore, these 3 queries are responsible for more than half of the Oracle consumption.
It is thus easy to determine what percentage of CPU, IOs, or even total consumption (Elapsed) is represented by a query or group of queries.