
By default, D.SIDE displays the status of the monitored database every 5 seconds. This short interval between two snapshots corresponds to the time during which D.SIDE pauses before fetching more recent information from the Oracle database dictionary. The queries executed by D.SIDE are designed and written to execute as quickly as possible in Oracle. However, certain situations may slow down D.SIDE’s operation: for example, when the network between D.SIDE and the database experiences latency, or if the Oracle shared pool area is so large that it causes slowdowns when querying the Oracle dictionary. To monitor these performance elements, D.SIDE provides several indicators on the main screen:
- The “Update status” progress bar at the bottom of the screen
- The “Last refresh” date at the bottom of the “Main Statistics” section on the left of the screen
- Additionally, the connection time to an Oracle instance can already be an interesting first indicator.
Update Status” Progress Bar
Between two snapshots, while D.SIDE is waiting, this progress bar is in the “Up to date” state, indicating that the screen has been updated and the displayed information is the most recent data retrieved from the Oracle dictionary:

During the retrieval of this information, i.e., while a snapshot is being executed, the status bar takes various values, specifying which part of the main D.SIDE screen is being refreshed. Example:

If the D.SIDE display refresh is slow, this bar helps identify what D.SIDE is currently searching for, which part is being executed, and if a support request needs to be opened, this is an important detail to include in the ticket to refine the analysis.
“Last Refresh” Date
The “Last refresh” value indicates the last time the displayed data was retrieved. This is the time from the server machine hosting the database, not from the client machine running D.SIDE. By default, D.SIDE pauses 5 seconds after retrieving all the data for a snapshot. Hovering over the “Last refresh” information provides the “Last interval,” which corresponds to the time elapsed between the last two snapshots. This time is expressed in milliseconds. For example, if processing a snapshot took 0 milliseconds, meaning the operation was instantaneous, the time between two snapshots would always be 5 seconds. But in reality, executing queries in Oracle, even when perfectly optimized, takes time, even if only a few milliseconds. Thus, most of the time, this area will show a value slightly higher than 5 seconds. Example:

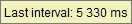
This information indicates that it took D.SIDE 330 milliseconds to fully process the snapshot. To easily and quickly observe any drift, the “Last refresh” information is highlighted in color when a snapshot takes more than one second to complete. Example:

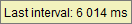
Here, it took 1.014 seconds to complete the last snapshot, so the information is displayed in color.
connection time
Finally, another indicator corresponds to the connection time to the Oracle instance you’re working with. It’s often observed that a long connection time already reflects an inefficient situation. It can therefore be useful, at times, to monitor this connection time, which is available in the logs at the start of D.SIDE. Example:
d.side - 2019-11-18 14:50:06 Starting d.side 261.910.171
d.side - 2019-11-18 14:50:06   d.side home = [C:/d.side]
d.side - 2019-11-18 14:50:14   Connected in 2.01 sec
When the connection time takes several seconds, this can already indicate a performance issue. Normally, this will be confirmed, if needed, by the other elements on the main screen, especially those we’ve just presented, which directly relate to D.SIDE’s behavior and performance.