
Introduction
The D.SIDE alerting module for Oracle allows for the detection of:
- An increase in activity or consumption: CPU, physical reads, number of sessions, etc.
- A decrease in activity: fewer queries executed, fewer transactions, etc.
- A drift in response time for a query.
Each alert indicates which threshold has been exceeded, either up or down, along with the corresponding value:
[STAT.LOW] user commits: current: 64 | limit: 100
[SESSIONS.HIGH] 843 sessions connected | limit: 800
[SQL] 2z88p343wmrj5 took 952 ms | limit: 200
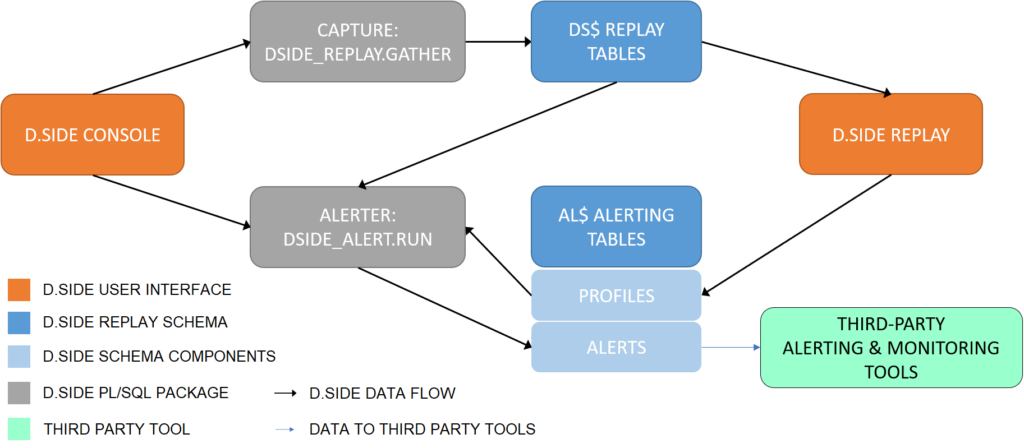
The alerts are stored in the AL$ALERTS table within the Replay collection schema. This table can be queried to search for alerts based on their type, frequency, date of occurrence, etc. Additionally, these alerts can optionally be output to a flat file via an Oracle DIRECTORY. Thus, standard monitoring tools can easily be connected to read the AL$ALERTS table or the contents of this flat file.
Architecture
The alerting mechanism relies on the collection process. It regularly monitors the data collected by the GATHER procedure from the DSIDE_REPLAY package. If the monitored statistics exceed the configured thresholds, an alert is triggered. The collection package now offers the option to run the collection in a “lightweight alerting” mode. In this mode, it does not store execution plan steps, for example. This information is intended for troubleshooting, not alerting. As a result, it’s easy to reduce the storage volume required for the collection’s operation, as well as the resource consumption of the collection job.
To determine which thresholds to use to decide whether or not to trigger an alert, the alerting mechanism needs to know, in addition to the collection tables, the statistics to monitor and the values to avoid exceeding—both higher and lower thresholds. To achieve this, one or more profiles are created.
Management of alert profiles

When clicking the alert button in the Replay interface, the values corresponding to the activity observed during the selected period are provided for the creation of a new profile:
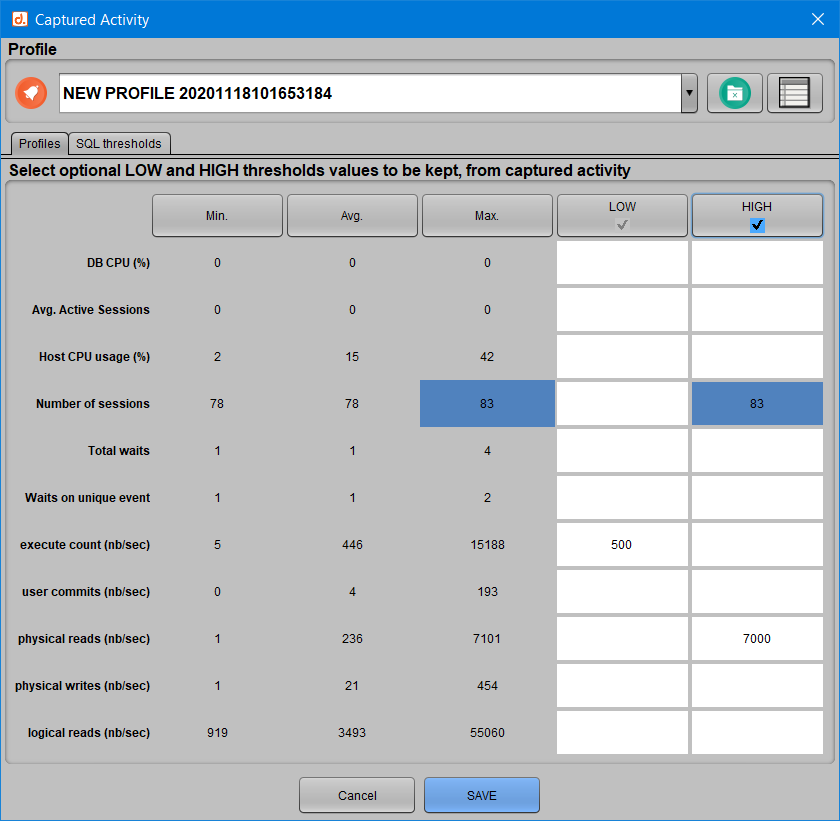
By clicking on a value, it is added to the list of thresholds that make up the profile. Clicking on a column allows you to add all the proposed values at once. Each value can also be manually adjusted. In addition to consumption and activity statistics, you can also monitor SQL queries. To do this, simply click on the same alert button from the ‘SQL Query History’ window in Replay:
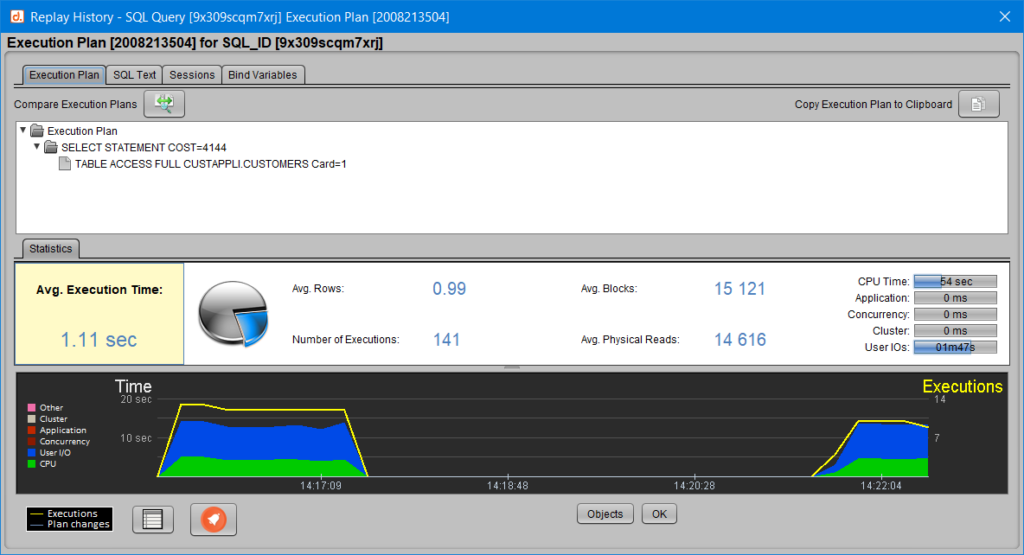
The SQL_ID and the average execution period of the query for the selected period are then directly added to the profile. You can also associate an optional label (which by default corresponds to the first characters of the query), and specify a unit in milliseconds, seconds, or minutes.
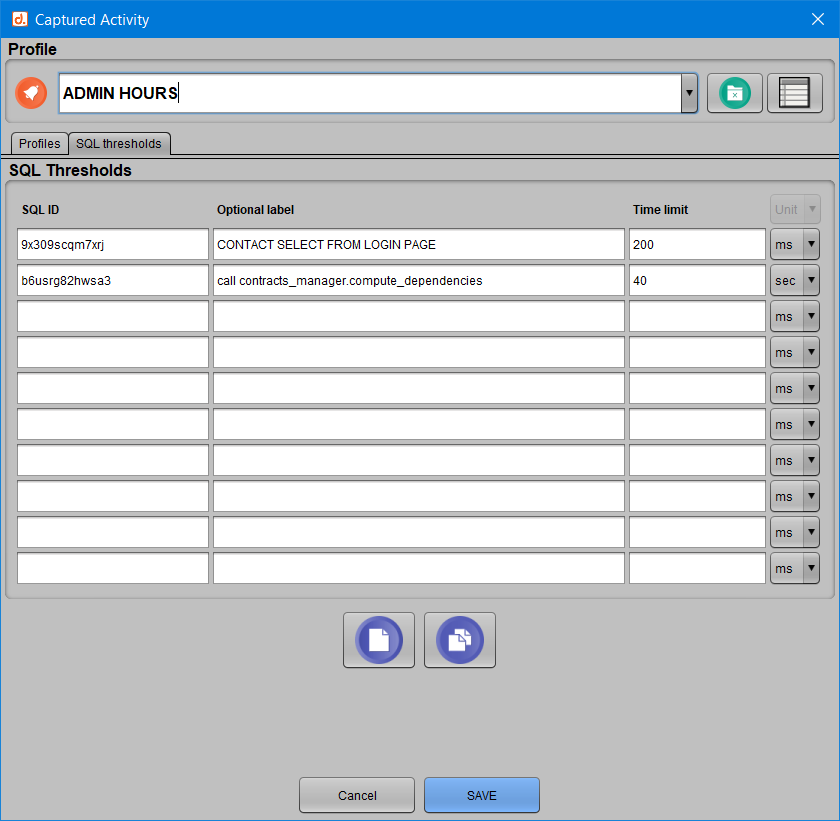
Give the profile a name and click the SAVE button to store the profile in the database. It can then be used by the alerting system. Of course, you can return to a profile at any time to update or delete it.
Managing Alerting Plans

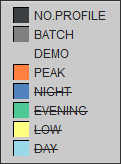
By clicking the “Alerting plans management” button, you can schedule an entire week of profiles. This feature is optional; you can work with profiles alone, but it allows you to easily adjust profiles based on expected activity: nighttime will not have the same activity as daytime, and a batch period will be more intense than a quiet weekend period, for example. This scheduling of profiles allows for controlling the thresholds the alerting job will react to, on an hour-by-hour basis. To configure the hours and profiles, a left-click starts a period and allows you to choose which profile corresponds to that period from the list of existing profiles, created as described in the previous section. Then, a right-click on the end time of that period allows you to extend the calendar according to the expected activity.
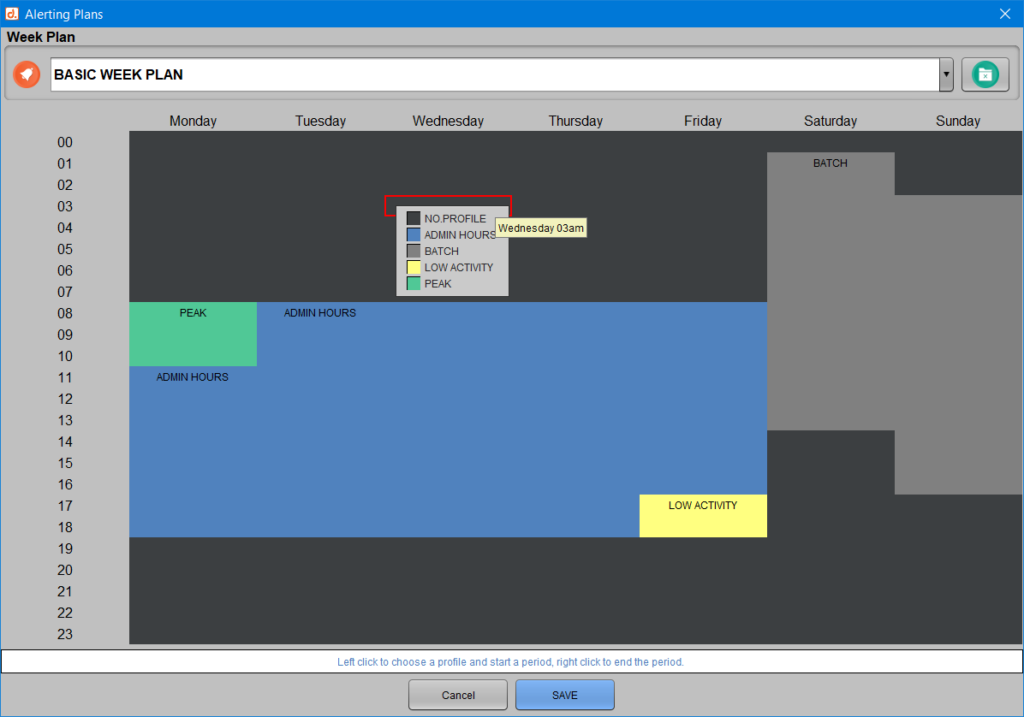
In this case, the alerter will not consider the missing profiles. It will only mention this situation in the admin messages.
Managing the Alerting Job
Once the profiles and plans are created, the D.SIDE Console allows you to start, stop, and monitor an alerting job, just like with collection jobs. On the main screen, an active alerting job is represented by a colored bell, while an inactive alerting job (when no alerting jobs are running) is represented by a grayed-out bell.
Starting an Alerting Job

To configure and start an alerting job, click on the grayed-out bell to enter the “Alerting Management” window, which indicates that alerting is not activated and offers various launch options:
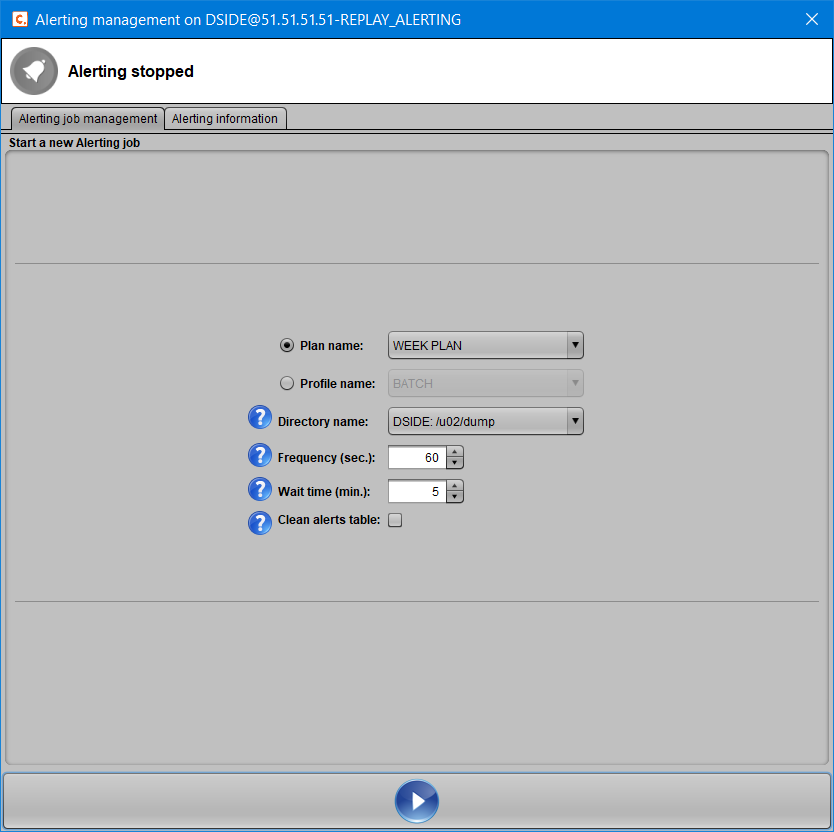
To start a new alerting job, you need to provide either a profile or a plan on which it will base its decisions on whether or not to trigger an alert. The “Plan name” and “Profile name” options are mutually exclusive and allow you to specify which thresholds the job should monitor. The “Directory name” is optional; it allows the alerts to be stored in a flat file in addition to the AL$ALERTS table. If an Oracle directory is accessible to the user connected (the Replay collection schema) and the user has the necessary privileges on the directory, it will be listed in the dropdown menu. The “Frequency” defines the interval between two checks by the alerting system. Here, the system checks every 60 seconds to see if there is new collected data to analyze. If a new alert needs to be triggered because a threshold is exceeded in the most recent collected data, the alerting system ensures that the “Wait time” minutes (5 minutes in this case) have passed since the last alert. This helps avoid overwhelming the operators’ alert consoles with redundant information, giving them time to analyze and address the first alert raised. Finally, before starting a new alerting job, you can choose to clear the AL$ALERTS table where previous alerts may have already been stored or processed.
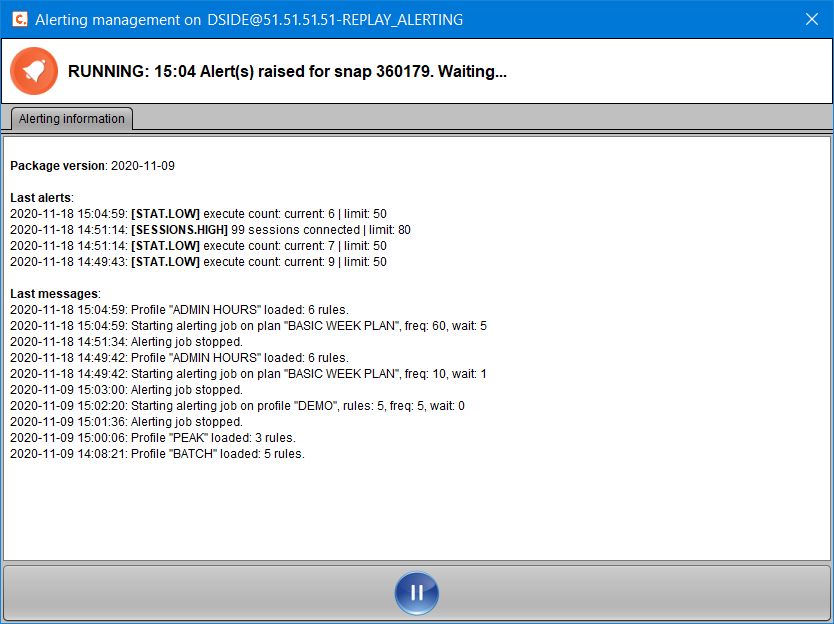
Retrieving Raised Alerts
While the alerting job is running, click the colored bell on the main screen to enter the same “Alerting management” window. This time, you’ll have the option to stop the job and view the job’s status, along with the raised alerts and the administrative messages posted by the job.
If an Oracle directory was specified when starting the alerting job, alerts can also be retrieved directly by reading the file:
[oracle]$ tail -f d.side.alerts.B2C.log
2020.11.18-15:23:43: [STAT.LOW] execute count: current: 740 | limit: 1000
2020.11.18-15:24:14: [SESSIONS.HIGH] 914 sessions connected | limit: 900
2020.11.18-15:24:14: [STAT.HIGH] physical reads: current: 1257 | limit: 1200
Finally, everything performed and encapsulated here through the D.SIDE Console can be executed automatically or via a script, relying on the DSIDE_ALERT package, primarily using the RUN procedure to start a collection job. For more information and details about the D.SIDE alerting module for Oracle, refer to the D.SIDE Interactive Replay Alerting Guide.