Objectives of D.SIDE Analyzers
The D.SIDE Analyzers, like the main D.SIDE screen, are designed to detect if the monitored Oracle instance is being affected by a performance issue. If so, they help point towards a resolution by identifying the cause of the slowdown or blockage. To achieve this, the goal is to identify any excess consumption or waiting. Once the symptoms are detected, the Analyzer helps us understand and explain the cause, enabling us to focus on the elements responsible for the issue.
Objectives of the Shared Pool Analyzer
In the case of the Shared Pool Analyzer, an excess is related to an abnormal demand on the Oracle memory area of the shared pool. This can manifest as, for example:
- An over-utilized or poorly managed Oracle shared pool memory area
- Sessions waiting on “latch-free” contentions in the library cache or shared pool
- Queries that consume a lot of memory space
- High CPU consumption used for parsing queries
- The number of queries to be analyzed far exceeding what should be necessary
- An Oracle component occupying shared pool memory space unusually
- A large shared pool memory area with never any free space left
The Shared Pool Analyzer helps observe how Oracle manages its shared pool memory area, particularly to detect queries that are consuming significant resources.
How to Use the Shared Pool Analyzer
The Shared Pool Analyzer contains three distinct areas.
Parsing

This section shows the value of the Oracle instance parameter cursor_sharing, as it has a significant impact on parsing and the use of the shared pool memory area. It also indicates how much CPU is being used in real-time by Oracle for parsing, which is the process of analyzing SQL queries before execution. As a reference, Oracle recommends in its Performance Tuning Guide that this statistic should be as close to 0% as possible.
Shared Pool Main Areas
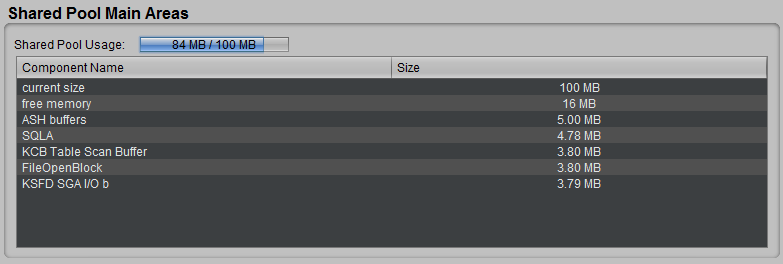
This area summarizes memory usage: total size and free space in the shared pool. The five most important components of this memory area are also displayed. This helps highlight when a component is using an unusually large share of the allocated space. If a component appears to be consuming too much memory, a search on the Oracle support site can be helpful, as this often points to Oracle bugs. The name of the component should be noted. For example, “KGH: NO ACCESS.” This section of the Shared Pool Analyzer allows for easy detection of such situations.
Shared pool content
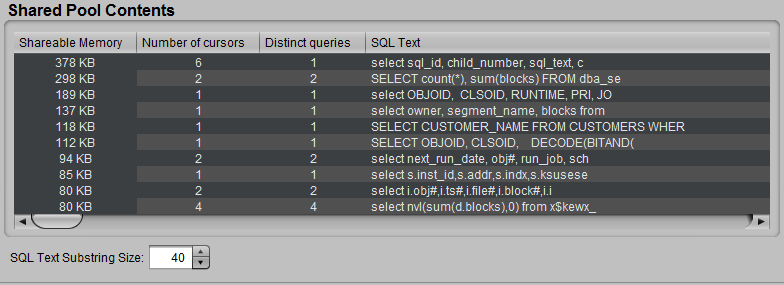
This section of the Shared Pool Analyzer shows which queries consume the most memory space. This is very useful for quickly and easily identifying SQL queries that could lead to shared pool memory saturation, those that might trigger the Oracle error ORA-4031 “unable to allocate %s bytes of shared memory” due to lack of space, or those that cause Oracle to consume too much CPU for query parsing instead of using that resource to execute the queries. SQL queries based on constants rather than bind variables are instantly detected in this section. For better clarity, only the top 10 SQL query types that consume the most shared pool memory are displayed in this list. The goal is to highlight the most important values, representing the queries that could cause issues, not to list everything.
Other Information
By double-clicking a row in the “Content” section to get more details on a query, you can open three types of windows.
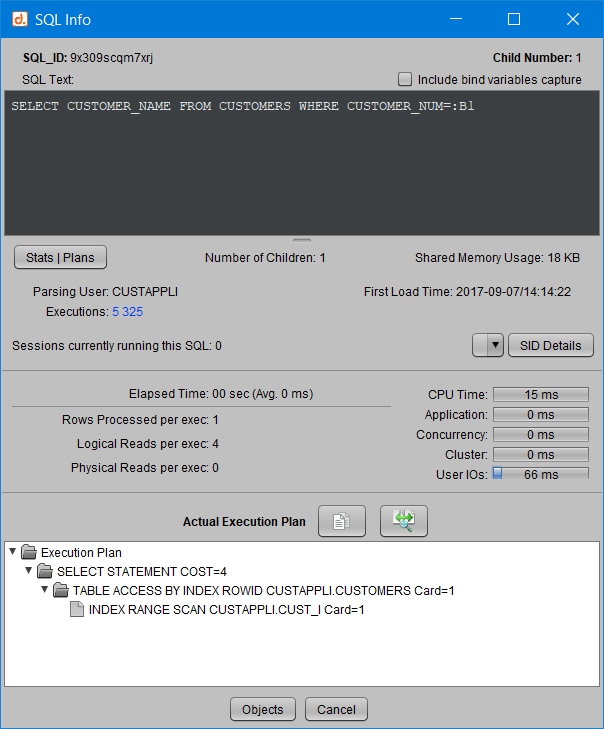
SQL Info
The selected row corresponds to a single “distinct query” and a single “cursor.”

In this case, D.SIDE directs you to the SQL Info window, which provides all the necessary elements for analyzing this query, from its text and execution plan to its execution statistics.
SQL Cursor Info
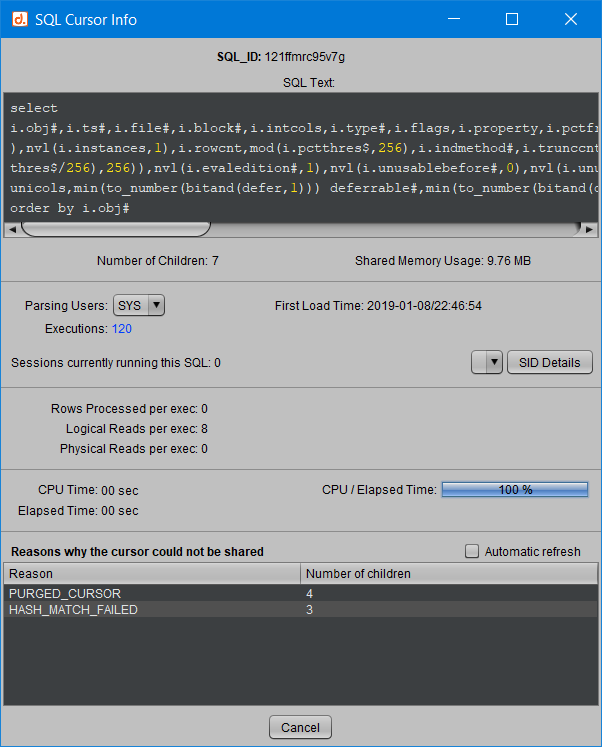
The selected row corresponds to a single “distinct query,” but the chosen query has multiple cursors, or “children.”

In this case, D.SIDE opens a “SQL cursor info” window that provides a summary of these different children. Specifically, when Oracle provides this information, it shows the reasons why these cursors could not be shared and why Oracle had to create multiple children.
Shared pool content Analyzer
In this case, the selected row groups several “distinct queries,” meaning multiple different SQL IDs.

These queries all begin with the same “n” characters, where “n” is the value provided in the “SQL text substring size” counter:

In this case, D.SIDE displays the complete list of queries starting with the same 40 characters, making it easy to highlight queries that could benefit from using bind variables rather than relying on constants.
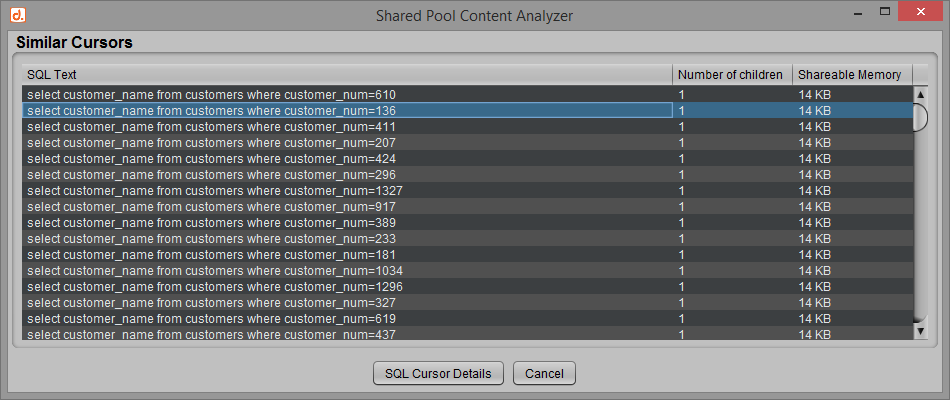
To go even further, it is again possible by double-clicking on a row in this window to get more details, either by entering a “SQL Info” window or a “SQL Cursor Info” window, depending on the number of children for the selected row.
How to Open the Shared Pool Analyzer
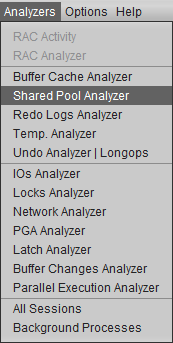
The Shared Pool Analyzer is accessible from the D.SIDE Analyzers menu:
You can also open the Shared Pool Analyzer by double-clicking on a wait event related to the behavior of the Oracle shared pool on the main screen. Example:

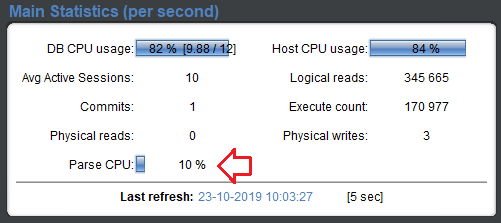
Additionally, clicking on the “Parse CPU” statistic in the “Main Statistics” area of the main screen also allows you to enter the Shared Pool Analyzer.
Use Case Examples
Case 1
The information provided by the Shared Pool Analyzer does not show any drift here. It indicates that there is no contention and that the queries are well-written, using memory evenly without excessive CPU consumption:
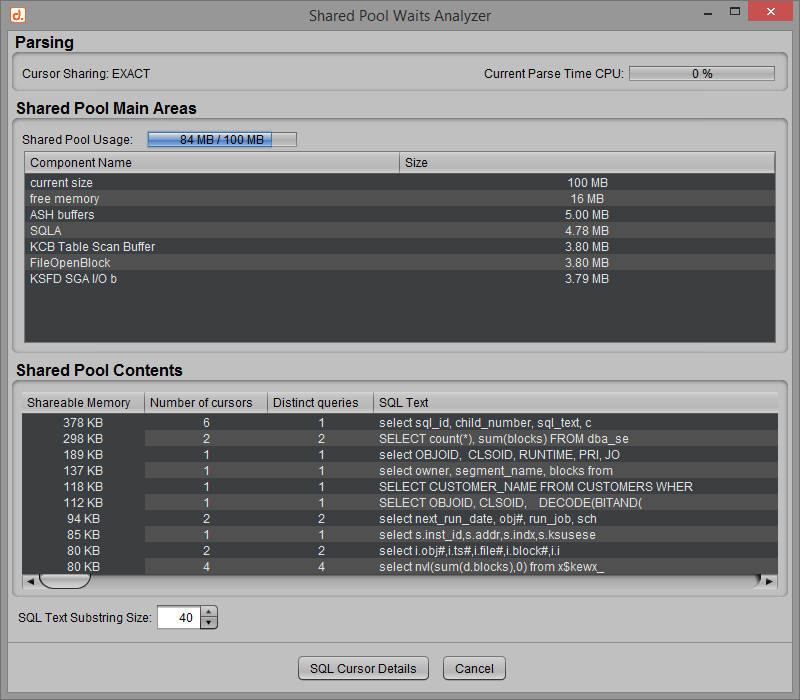
The Oracle shared pool does not appear to be causing any issues here, and no components or SQL queries are identified as areas for optimization.
Case 2
On the other hand, here we observe a type of SQL query that occupies a quarter of the shared pool memory by itself.
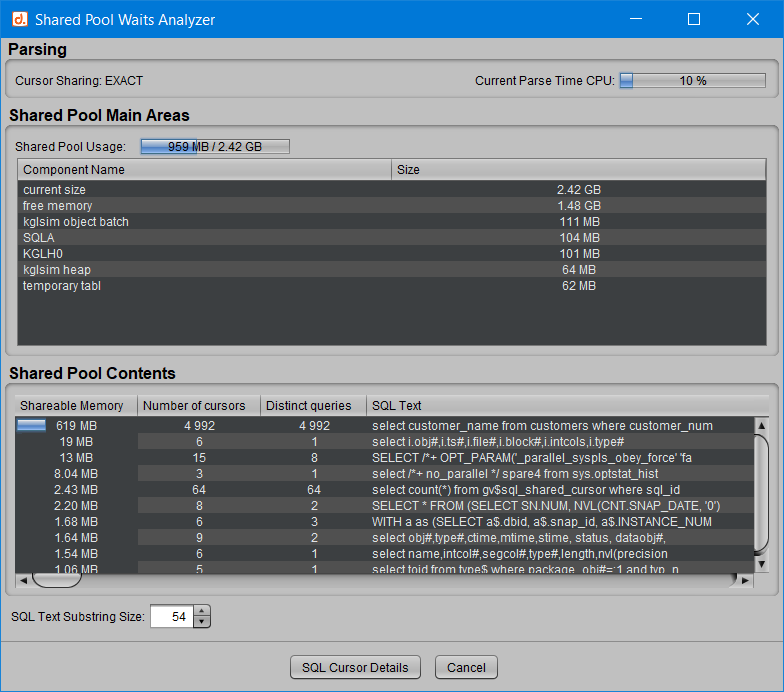
All 5,000 queries starting with the first 54 identical characters alone occupy 25% of the shared pool memory allocated. The 619 MB reported out of the total 2.42 GB size indeed represents 25%, as indicated by the “Sharable Memory” progress bar for this row. These 5,000 queries are all based on the same text:
select customer_name from customers where customer_num...
Additionally, the CPU usage for parsing seems abnormally high, with 10% of the resources being used to analyze the queries, rather than executing them (e.g., retrieving rows for a SELECT). These factors led to the suggestion to rewrite these queries using a bind variable instead of the 5,000 different constants.
Conclusion
The D.SIDE Shared Pool Analyzer allows for precise and rapid observation of everything important to know about the operation of the Oracle shared pool. This makes it possible to detect and identify the cause of slowdowns or contentions in this memory area. The causes of these performance issues could be related to the way an SQL query is written or the shared pool memory is too small, for example. There are many Oracle bugs related to cursor management in the shared pool, but in most cases, using bind variables instead of constants in the identified SQL queries will be the most effective way to resolve the issues or reduce waits in this memory area. This can involve using the Oracle instance parameter cursor_sharing. Optimizing the parsing phase will also help prevent Oracle errors like ORA-4031 “unable to allocate %s bytes of shared memory
