
OBJECTIVES OF D.SIDE ANALYZERS
D.SIDE Analyzers, like the main D.SIDE screen, are designed to detect whether the monitored Oracle instance is experiencing performance issues. If so, they help pinpoint the source of the slowdown or blockage, guiding towards a resolution.
The goal is to identify any excess consumption or waiting. Once symptoms are detected, the Analyzer helps us understand and explain the underlying cause, allowing us to focus on the elements responsible for the issue.
OBJECTIVES OF THE LOCKS ANALYZER
In the case of the Locks Analyzer, an excess is related to blocking or contention during the execution of queries or transactions.
This can manifest as, for example:
- A session blocking one or more other sessions
- Locks placed at the row level
- Locks placed at the table level
- An object receiving numerous locks
- Contentions in the library cache or shared pool
- A procedure being compiled and used simultaneously
- Slowdowns caused by longer waits on a lock
- Prolonged application processing time while a lock is held by a SELECT FOR UPDATE
The Locks Analyzer allows you to observe who is blocking whom, on what, and for how long, to detect whether a session, object, or query is responsible for the blocking.
HOW TO USE THE LOCKS ANALYZER
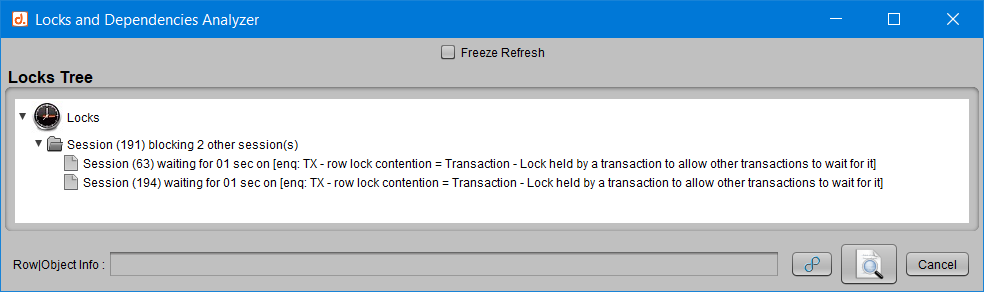
The main component of the Locks and Dependencies Analyzer is the dependency tree.
LOCKS TREE
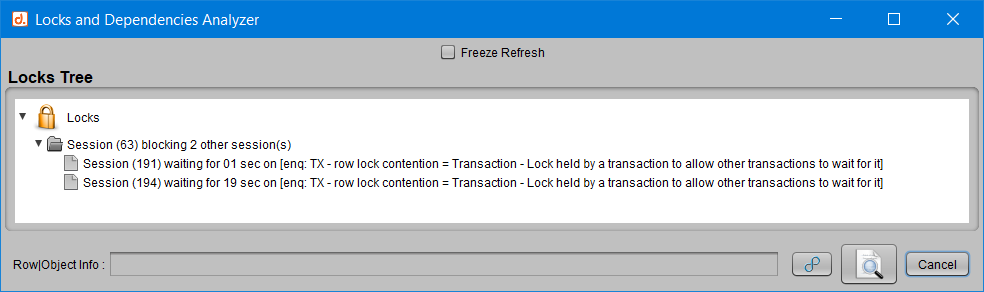
This area, in the form of a tree, shows the sessions that depend on each other.
In the example above, the Locks Analyzer indicates that:
- The observed situation is considered by D.SIDE as a locking issue. This is why the icon at the root of this tree is a lock.
- Session 63 is blocking two other sessions (191 and 194) on a lock of type “enqueue TX – row lock contention.”
- In the case of enqueues, a full description of the lock type encountered is provided. Here, “TX” corresponds to a transaction.
- Session 191 has been waiting on this enqueue TX lock for more than one second.
- Session 194 has been blocked on this lock for just under 20 seconds.
The displayed information is updated with each new D.SIDE snapshot, after each interval (default is every 5 seconds).
For better readability, it can be useful to check the “Freeze Refresh” box to freeze the content of this dependency tree, preventing it from being updated constantly.
By double-clicking or right-clicking on a row in the “Locks Tree,” you can obtain more details about the selected session.
SESSION INFO
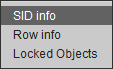
For example, double-clicking or selecting the “SID Info” entry from the context menu (right-click) opens a “Session Info” window that allows you to track detailed information about the selected session.
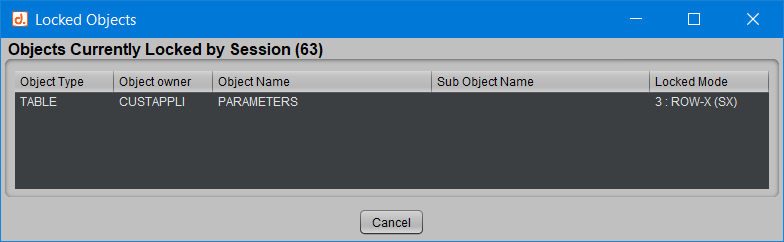
SESSION LOCKED OBJECTS
Via the right-click button, the “Locked Objects” entry opens a “Locked Objects” window for the selected session. In this window, you can observe all the locks held by this session:
ROW | OBJECT INFO
The “Row Info” entry in the right-click menu provides detailed information about the object involved in the dependency. It will even retrieve the ROWID if it’s a row-level lock, as in the case of an enqueue TX:
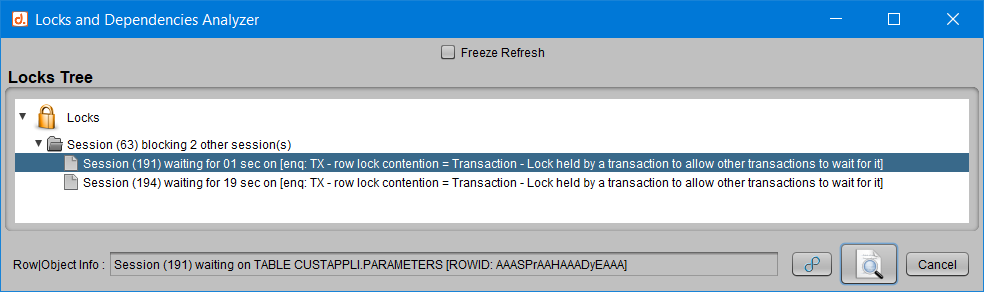
The “Row Info” button in the case of a “library cache lock” wait will instead show which procedure is currently being used while attempting to recompile it, for example, leading to a locking situation of a different type than an enqueue related to a transaction.
GLOBAL LOCKED OBJECTS

Regarding locked objects, you can also click on the “Locked Objects” button.
This opens a “Locked Objects List” window, allowing you to quickly see which objects are locked and how many times each one is locked.
For example, here the table PARAMETERS from the CUSTAPPLI schema is involved in 2 lock waits (value 2 in the “Locked Sessions” column), which corresponds to 100% of the locks recorded on this instance (the progress bar in this column is full).
This makes it very easy to detect if a session or object is responsible for a significant portion of all locks placed.
If necessary, you can also drill down to the partition level, and the partition name will appear in the “Sub Object Name” column.
DEADLOCKS

Although very rare, under certain load conditions or due to bugs, Oracle may fail to detect a deadlock and leave two sessions in a waiting state indefinitely.
To address this issue, D.SIDE offers a “Deadlock detection” button that searches for sessions that could be affected by such a situation.
RAC OPTION
If the D.SIDE RAC option is subscribed to and multiple instances are involved in a blocking situation, you can easily navigate between instances automatically. If the option is not subscribed to, the user can only observe one instance at a time.
HOW TO OPEN THE LOCKS ANALYZER
The Locks Analyzer is accessible from the D.SIDE Analyzers menu:
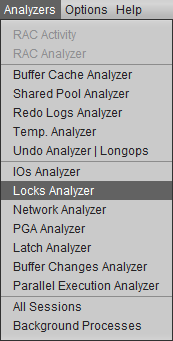
Additional Information:If the D.SIDE RAC option is also enabled, the Locks Analyzer provides an immediate, comprehensive view of session dependencies across the entire cluster. Without this option, the user is limited to checking dependencies on each node of the RAC cluster.
Another way to open the Locks Analyzer is by double-clicking on a wait event related to locking or session dependency from the “Wait Events” list in the main D.SIDE screen.
For example, a wait event such as “enqueue,” like “enq
,” or a wait event like “library cache lock,” can lead the user directly into the Locks Analyzer.
USE CASE EXAMPLES
CASE 1: Lock

Referring back to the situation displayed at the beginning of this article, the information provided by the Locks Analyzer highlights a locking issue.
There is also a lock icon at the root of the “Locks Tree” dependency tree.
CASE 2: Performance Issue

This time, the information presented by the Locks Analyzer highlights a performance issue.
Session 191 has been blocking sessions 63 and 194 for just over a second on an enqueue TX lock, but the observed locks are merely a consequence of the performance issue. The waits are just the symptom.
By displaying a stopwatch icon, D.SIDE points us toward a performance issue, not simple locking.
Therefore, there’s no need to kill the sessions involved, especially session 191 in this case, as that won’t solve the problem. It’s better to return to the main D.SIDE screen and use other Analyzers to track down the origin of the slowdown.
PARTICULAR CASE OF THE LIBRARY CACHE LOCK
When a “library cache” wait is detected, D.SIDE determines whether it’s a session-blocking situation or if performance degradation is due to contention in the shared pool.
• In the first case, the user is directed to the Locks Analyzer for all the details about who is blocking whom, for how long, and on which object.
• In the second case, the contention leads the user to the Shared Pool Analyzer to observe Oracle elements that might help understand what is causing the degradation. For more information on how the Shared Pool Analyzer works and how to interpret its data, we encourage you to consult the dedicated article: https://www.dside-software.com/blog-shared-pool-analyzer/.
CONCLUSION
Locking situations or session dependencies are common in applications using relational databases.
The goal of D.SIDE’s Locks Analyzer is to determine whether the observed situation is normal, acceptable, or if it represents a problem affecting the application’s proper functioning. The distinction between a locking situation and a performance issue helps save time in the analysis. Moreover, the Locks Analyzer provides all the information needed to quickly and easily identify the elements involved, helping refine the analysis: sessions, queries, objects, ROWIDs of the rows, etc.