Objectives of D.SIDE Analyzers
The Analyzers, like the main D.SIDE screen, are designed to detect if the monitored Oracle instance is experiencing performance issues. If so, they help pinpoint the cause of the slowdown or blockage.
The goal is to identify any excess consumption or waiting.
Once the symptoms are detected, the Analyzer helps us understand and explain the underlying cause, allowing us to address the elements responsible for the issue.
Objectives of the Buffer Cache Analyzer
In the case of the Buffer Cache Analyzer, an excess is related to abnormal demand on the Oracle buffer cache.
This can manifest as, for example:
• An over-utilized or poorly managed Oracle buffer cache
• Sessions waiting on contentions within the buffer cache
• Queries consuming high CPU resources
• Queries processing a large number of blocks
• Objects or segments being accessed too frequently
• High CPU consumption at the machine (host) level
• “Latch free” contentions on the Oracle buffer cache
The Buffer Cache Analyzer allows you to observe how the Oracle buffer cache behaves, helping to identify queries, sessions, or objects that are causing significant resource consumption.
How to Use the Buffer Cache Analyzer
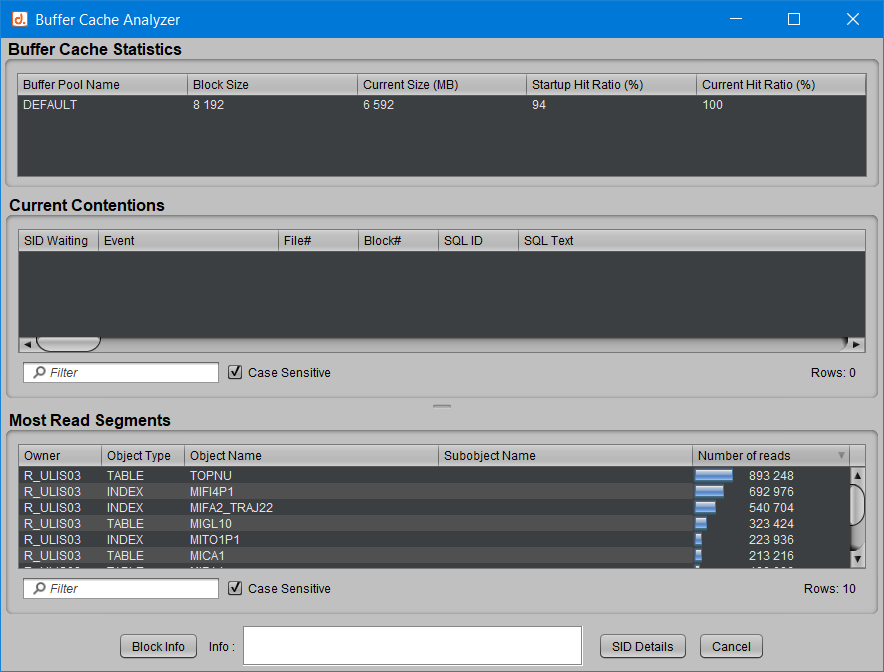
The Buffer Cache Analyzer contains three distinct areas:
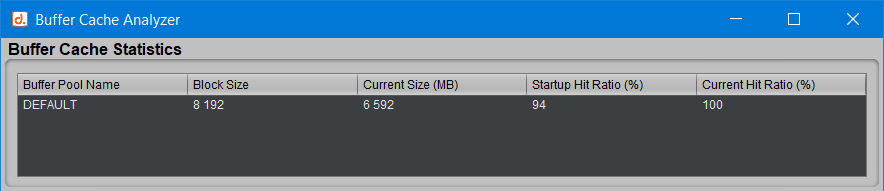
Oracle Buffer Cache Statistics
This section presents the configuration and statistics related to the Oracle buffer cache’s configuration and usage: pool names (DEFAULT, RECYCLE, KEEP), actual size, block size (4K, 8K, 32K…), and the average buffer cache hit ratio (since instance startup) and real-time.
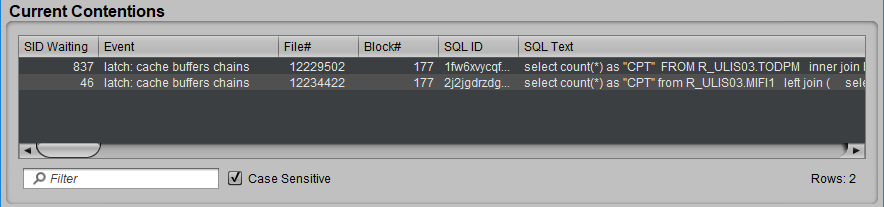
Current Contentions
If sessions are waiting on contentions related to the Oracle buffer cache, this area lists them, specifying who is waiting on what — that is, which session is blocked, what SQL query it is executing, and which Oracle wait event it is waiting on.
Depending on the observed wait (e.g., “buffer busy wait”), details of the block in contention are also displayed, allowing you to detect whether the contention is related to a specific data or index block, or if the waits are spread across a larger area.
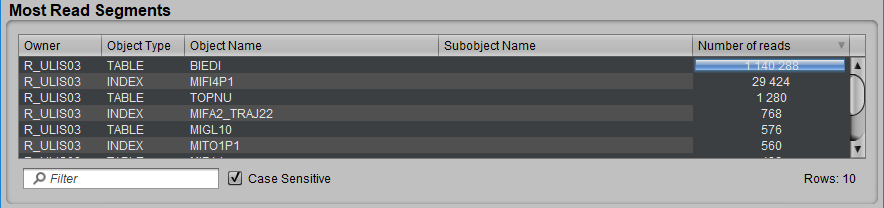
Most Read Segments
A unique feature offered by D.SIDE, this section does not show the volume occupied by each object in the Oracle buffer cache, but rather its level of usage. This allows you to quickly see if a small table is highly accessed, potentially causing waits, while a large table with no performance issues will not be displayed here.
It’s a very effective tool for determining, for example, if an index was poorly chosen or is being poorly utilized by Oracle in an execution plan.
The information displayed here includes the object’s identification with its name, type (INDEX, TABLE, etc.), the schema it belongs to, whether it’s a partition (Subobject Name), and how many times the object was accessed during the interval (by default, an interval corresponds to 5 seconds in real-time or one minute in Replay, representing the time elapsed between two information refreshes by D.SIDE or between two snapshots).
Along with the number of times the object was accessed, the progress bars indicate the relative importance of this value. For example, in the following case, it is easy to identify that the observed Oracle activity is almost exclusively related to the table BIEDI, whose blocks were accessed over a million times in the interval, representing about 95% of all traffic in the Oracle buffer cache.
For better clarity, only the top 10 most accessed segments in the Oracle buffer cache are displayed in this list. The goal is to focus on the most significant values, representing the objects that may pose problems, rather than listing everything.
Other Information
You can obtain even more details from these areas:
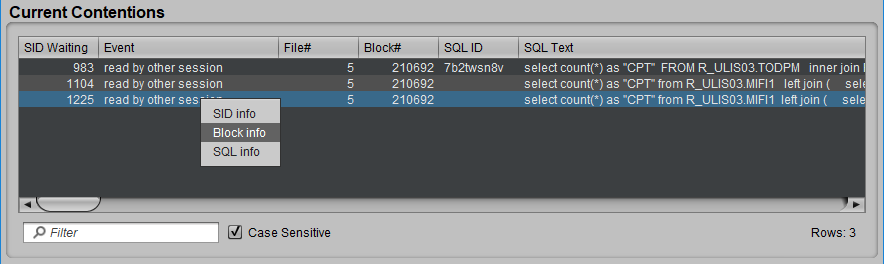
• Double-click on a row in Current Contention: which opens a Session Info window for the waiting session.
• Right-click on a row in Current Contention: which opens an SQL Info window for the query.
• Right-click on a waiting session: depending on the wait, the Block Info section will specify the object involved in the contention.
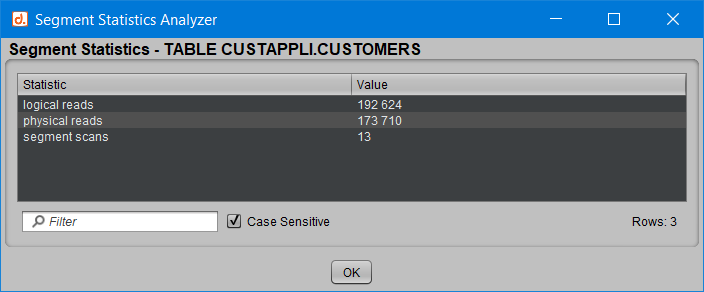
• Double-click on a row in the Segments area: which opens a Segment Statistics window.
How to Open the Buffer Cache Analyzer
The Buffer Cache Analyzer is accessible from the D.SIDE Analyzers menu:
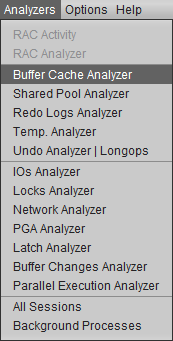
You can also open the Buffer Cache Analyzer by double-clicking on a wait event in the main screen that corresponds to a wait related to the behavior of the Oracle buffer cache.
Example:
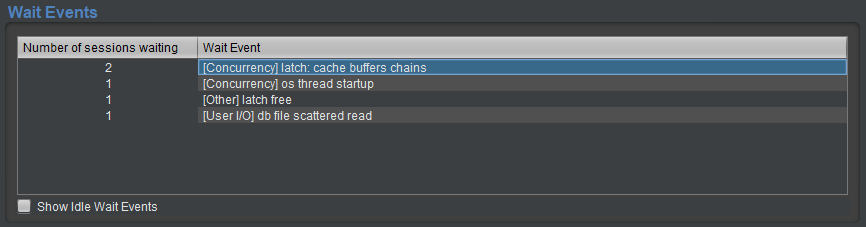
Additionally, clicking on the “logical reads” statistic in the “Main Statistics (per second)” section of the main screen also allows you to enter the Buffer Cache Analyzer.
use cases
Case 1
The information provided by the Buffer Cache Analyzer indicates that there is no contention and that the objects are being used evenly in memory:
The Oracle buffer cache does not appear to be causing any issues here, and no session or SQL query is identified as an element needing optimization.
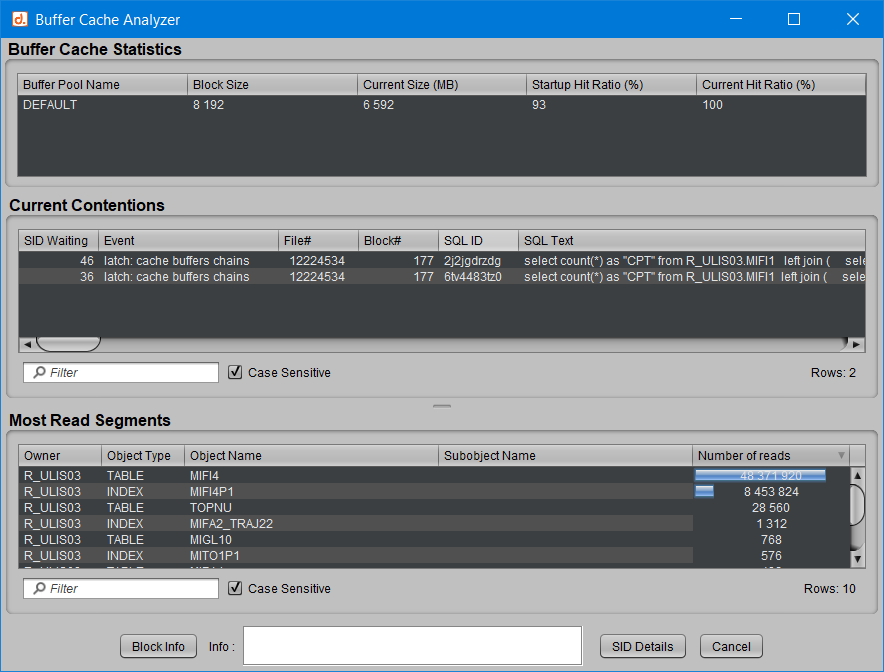
Case 2
On the other hand, here we observe contention related to two different SQL queries, but with similar structures. The only table, MIFI4, is accessed more than 48 million times during the interval, which represents over 80% of all activity and nearly six times more than the next object in the list.
These factors led to optimizing the two queries, for which a poor execution plan was chosen by Oracle due to an issue with the statistics used by the optimizer.
Conclusion
The D.SIDE Buffer Cache Analyzer allows for precise and rapid observation of everything important to know about the operation of the Oracle buffer cache. This enables the detection and identification of the causes of slowdowns or contentions in this memory area.
The causes of these performance issues could be a session, an SQL query, a buffer cache that is too small, etc.
Very often, issues related to the buffer cache are accompanied by other symptoms visible on the main D.SIDE screen: CPU consumption by Oracle or the machine, queries consuming a lot of CPU or blocks, contentions, and “latch-free” wait events.
In most cases, optimizing the identified SQL queries will be the most effective way to resolve problems or waits related to the buffer cache.