
WITHOUT BIND VARIABLES, DIAGNOSTICS BECOME MORE COMPLICATED
When many individually fast queries are executed, it becomes difficult to determine which SQL statements are the costliest among the Oracle activity. Each query may only take a few milliseconds of elapsed time, making it nearly impossible to spot in activity reports, even though the total time for all these queries combined could amount to several minutes or hours of processing.
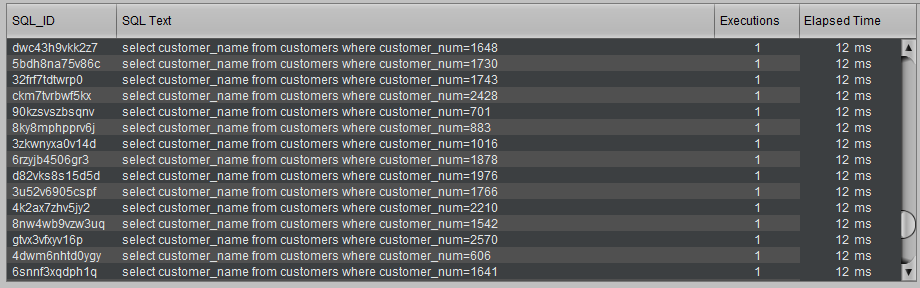
Take, for example, the following queries:
select name from customers where customer_num = 12;
select name from customers where customer_num = 345;
select name from customers where customer_num = 6789;
...
These queries, while similar, do not use a bind variable, and the repeated use of a constant prevents getting a comprehensive view of the cost of this type of query.
If each query takes only 12 milliseconds, they will all be “invisible,” as none will appear resource-intensive, even if 1 million of these similar SQL queries are executed. It then becomes unlikely to easily explain why Oracle requires so much CPU to run or why a process takes so long to complete since no specific query will be visible to confirm it.
Example :
OBJECTIVE OF THE GROUP MATCHING FEATURE
With the Group Matching feature, identical queries can now be grouped to better observe their total cost.
This means that in the current case, instead of seeing 1 million “insignificant” queries, each taking only 12 ms, D.SIDE will highlight a group of 1 million similar queries that together consume 1 million x 12 ms, or over 3 hours of processing time in Oracle. This grouping of queries then makes the cause of resource or time consumption in Oracle much more visible.
The diagnosis is no longer the same..
HOW GROUP MATCHING WORKS
When the Replay collection job is launched with the Group Matching option, it groups all these similar queries as if they were using a bind variable: select name from customers where customer_num = :1; Now, instead of dealing with a million small, distinct queries each executed once in 12 ms and thus “invisible” in activity reports, we have a single group of 1 million queries. This makes it much easier to highlight the fact that these previously isolated queries now form a group that totals 1 million executions and more than 3 hours of elapsed time, CPU, or I/O. Example:

This table summarizes the situation as follows: In the first column, Replay indicates that the group identified by ‘8DACA5209C70E871’ contains 1,048,230 queries that were grouped by the collection job because they are considered similar in their structure. The group identifier is calculated and assigned by the Group Matching feature, much like an SQL_ID is calculated by Oracle during the parsing of each query. The queries in this group, as shown in the second column, all have a similar text structure like this:
select name from customers where customer_num = 123
The value ‘123’ displayed here is simply the first value that was analyzed and thus retained when this group was created by the collection process. In reality, more than 1 million different ‘customer_num’ values were passed to Oracle during the executions, but the first one observed is what Group Matching keeps. The ‘Executions’ column shows that the queries in this group total the same number of executions as the number of queries included in the group: each query was executed once. Finally, and this is the main goal of the Group Matching feature, the total accumulated time for these queries, over 3 hours, is now clearly visible. Unlike the initial situation where it was difficult to see where the time was spent in Oracle, we can now easily and quickly observe which SQL statements are responsible for Oracle consumption.
DIFFERENT LEVELS OF GROUP MATCHING
The GATHER procedure in the DSIDE_REPLAY package, which launches the collection job, offers the ability to set the Group Matching option at 4 levels of granularity.
The Group Matching Option “Disabled”
This is the default value:
gmatch => 0
In this case, the option is not enabled, and the collection treats and stores each SQL statement independently. Replay will show a million different queries, each consuming only 12 ms.
The Group Matching Option “Every Statement”
This is the “opposite” value to the default:
gmatch => DSIDE_REPLAY.gmatch_all
In this case, the collection job checks whether each captured SQL statement belongs to a group of queries with similar text.
The Group Matching Option “Every Statement Except PL/SQL”
Since PL/SQL blocks (anonymous blocks, procedures, functions, packages) execute multiple SQL queries themselves, it is often more efficient to group only the SQL queries and not these PL/SQL blocks, to avoid “double work” during collection. All PL/SQL blocks will then be assigned to a unique group with the identifier ‘COMMAND:47’, even if the blocks themselves have no direct relation. The key is to search and group the underlying SQL queries to estimate their cumulative cost, rather than trying to find similarities between the calling blocks. This means that the following two blocks, for example, even though they have nothing in common except being PL/SQL blocks, will be assigned to the same group ‘COMMAND:47’, which stands for “PL/SQL EXECUTE”:
begin dbms_stats.gather_table_stats(...); end;
begin declare ... select count(*) from ...; end;
When a Group Matching value is calculated by the collection, the group is identified by this value (like “8DACA5209C70E871” from earlier). When you choose the “Every statement except PL/SQL” option, PL/SQL blocks are not processed for Group Matching and are instead assigned a common identifier “COMMAND:47,” saving resources during collection by avoiding unnecessary calculations on the block text. The queries within these blocks will still be handled by Group Matching. This level of Group Matching thus reduces resource consumption during collection by placing all PL/SQL blocks into the same group. To enable this, the option is set as follows:
gmatch => DSIDE_REPLAY.gmatch_all_except_plsql
The Group Matching Option “DML + Statements Only”
You can further reduce the workload of the collection job by calculating Group Matching only for SQL statements of the following types:
SELECT
INSERT, UPDATE, DELETE, MERGE
CREATE TABLE, CREATE MATERIALIZED VIEW
This covers nearly all Oracle activity: SELECT, DML, and CREATE TABLE.
Any SQL statement of another category (e.g., ALTER INDEX, CREATE SYNONYM) will be assigned its command number. For example, all CREATE INDEX statements will be assigned to the group ‘COMMAND:9’.
The Oracle “Reference” documentation shows the command numbers corresponding to different types of SQL statements: • 9 for CREATE INDEX • 47 for PL/SQL EXECUTE, etc.
With this level of Group Matching, all SELECT, DML, and CREATE TABLE statements will always be grouped based on similar queries to facilitate tracking their consumption. At the same time, all CREATE INDEX statements will be grouped into “COMMAND:9,” PL/SQL blocks into “COMMAND:47,” and so on.
In this example, the default groups that were not calculated are highlighted in yellow:
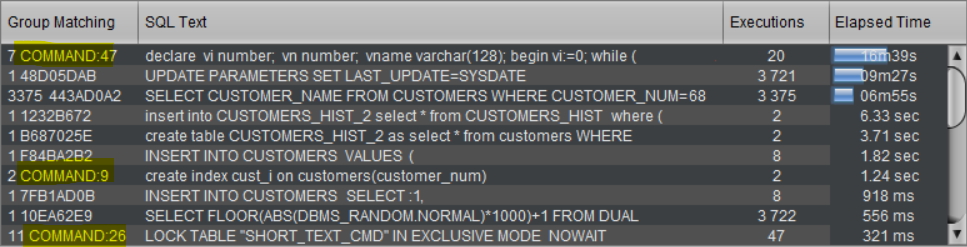
The first group contains 7 distinct PL/SQL blocks. Then, 2 different CREATE INDEX statements are grouped into a single group. Lastly, 11 different LOCK TABLE operations are assigned to the final group. As with all groups, only the text of the first PL/SQL block, the first CREATE INDEX statement, or the first LOCK TABLE operation is retained.
SQL statements of type SELECT, DML, and CREATE TABLE, however, undergo a precise Group Matching calculation. We do not group all SELECT statements into one group or all INSERT statements into another global group.
This level of Group Matching thus reduces the number of groups to be created, focusing on the most important SQL statements.
To enable this, pass the following option to the DSIDE_REPLAY.GATHER procedure:
gmatch => DSIDE_REPLAY.gmatch_only_dml_ddl
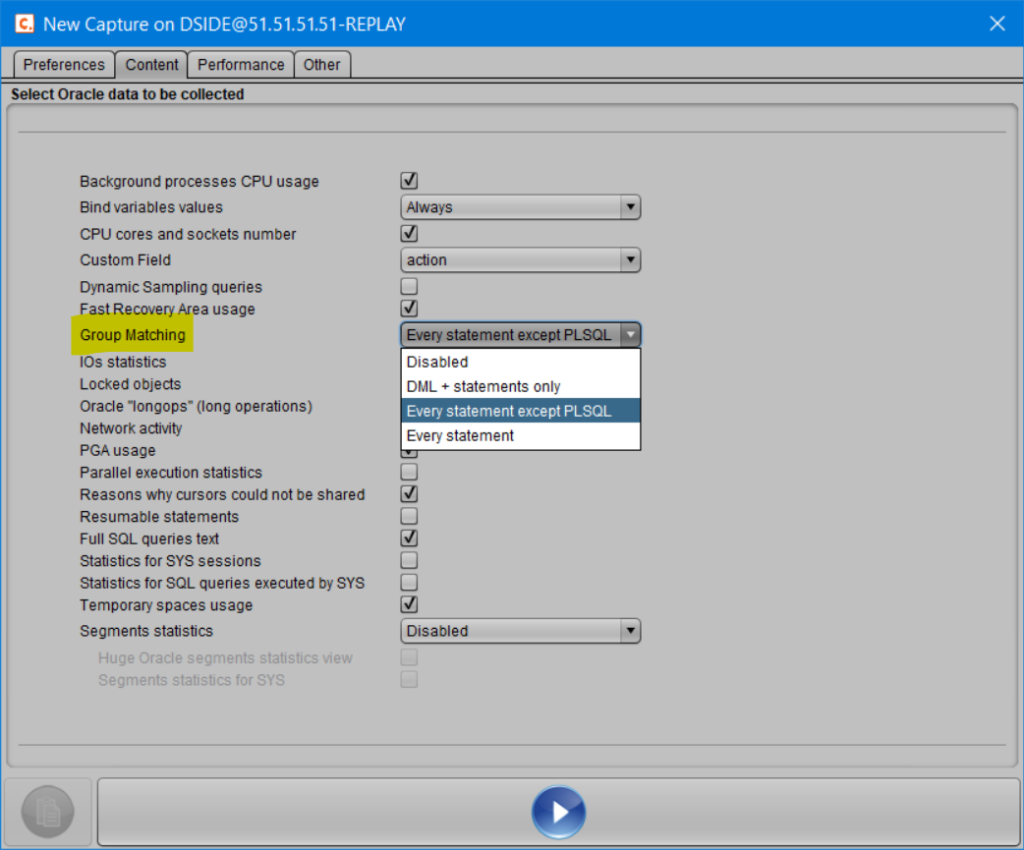
HOW TO ENABLE GROUP MATCHING
The different levels of Group Matching presented are set when launching the collection via the DSIDE_REPLAY package.
Example :
execute DSIDE_REPLAY.GATHER (interval=>60, iostats=>true, gmatch=>DSIDE_REPLAY.gmatch_all, pga=>true);
Of course, these different levels of Group Matching are also available from the D.SIDE Console when starting a new collection job.
CONCLUSION
This feature is very useful for detecting which types of queries consume the most resources in Oracle when the corresponding SQL statements are not visible due to the use of constants instead of bind variables in their syntax. Group Matching is often activated temporarily to gain a better understanding and provide a global view of activity, highlighting the SQL queries responsible for Oracle consumption. Different levels of granularity allow this Group Matching option to be used in a way that provides more or less detail on the activity while adjusting the CPU consumption required for group calculation during collection. Finally, unless exceptions apply, it is often more efficient to use bind variables rather than constants. While Group Matching can highlight these patterns, ensuring that queries are rewritten with variables (via development or using the Oracle cursor_sharing parameter) is a performance improvement that should be considered. This topic is also addressed in the articlehttps://www.dside-software.com/blog-shared-pool-analyzer/.