A query is currently running, and the SQL Info window allows you to monitor it:

The performance of this query degrades after a certain period.
Opening another SQL Info window allows you to monitor its new behavior:
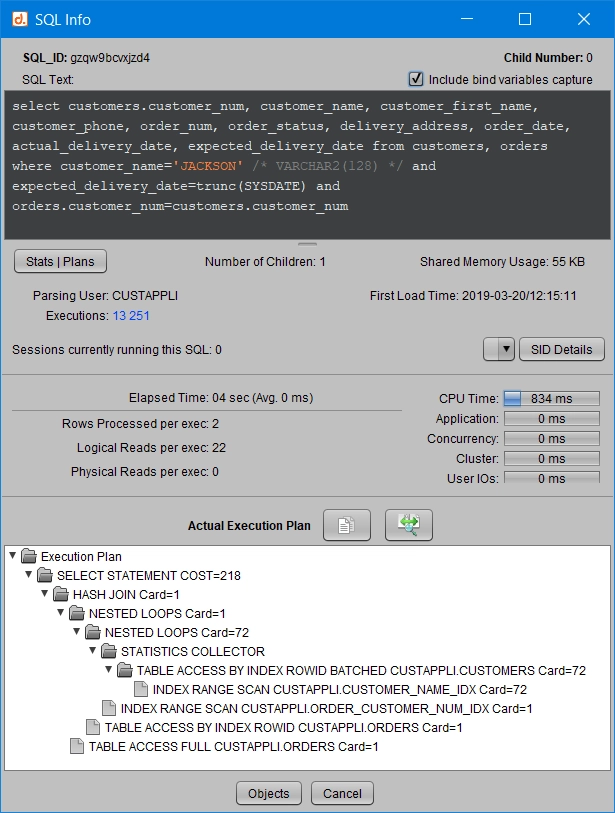
At first glance, there doesn’t seem to be much difference between the two behaviors of this query, but its execution plan has changed, notably increasing the number of blocks touched per execution (“logical reads”) from 20 to 22, which represents a 10% degradation experienced by users.
It’s not easy to precisely detect what has changed in the execution plan.
To instantly observe the differences between two execution plans, the SQL Info window provides a “Plans comparison” button:

Clicking this button once will select the first execution plan, and a message will confirm this:

The second execution plan can then be selected in turn from the second SQL Info window by clicking the same button:
The differences between the two plans are then highlighted using two colors:
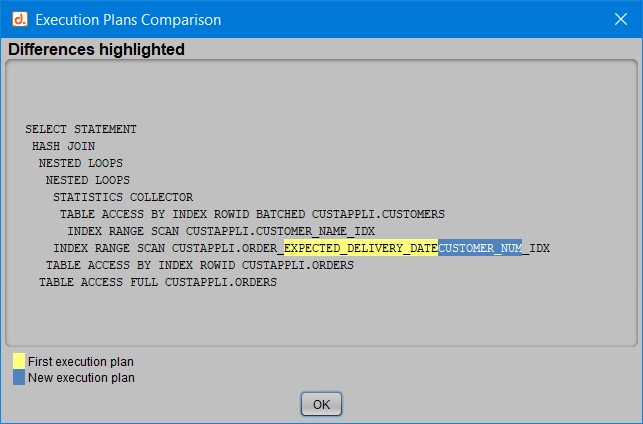
Yellow corresponds to the first selected execution plan, and blue to the second plan.
In this example, you can quickly see that the ORDER_CUSTOMER_NUM_IDX index is now chosen by the optimizer, while previously Oracle used the ORDER_EXPECTED_DELIVERY_DATE_IDX, which is more efficient.
Some situations then become very easy to understand, such as:
- An index change
- Switching from an index to a full scan
- Choosing a HASH JOIN instead of a NESTED LOOPS
- Reversing the order of the two tables
- …
Of course, sometimes the differences between two execution plans are far more numerous, and reading them may be more complex than in this example, but it illustrates how plan comparison works.